Computing Power Management
The Computing Power Management module is one of the core features of the CSGHub Admin Panel, designed to provide administrators with global computing resource monitoring, specification definitions, cluster and node maintenance, and task scheduling management capabilities.
1. Overview
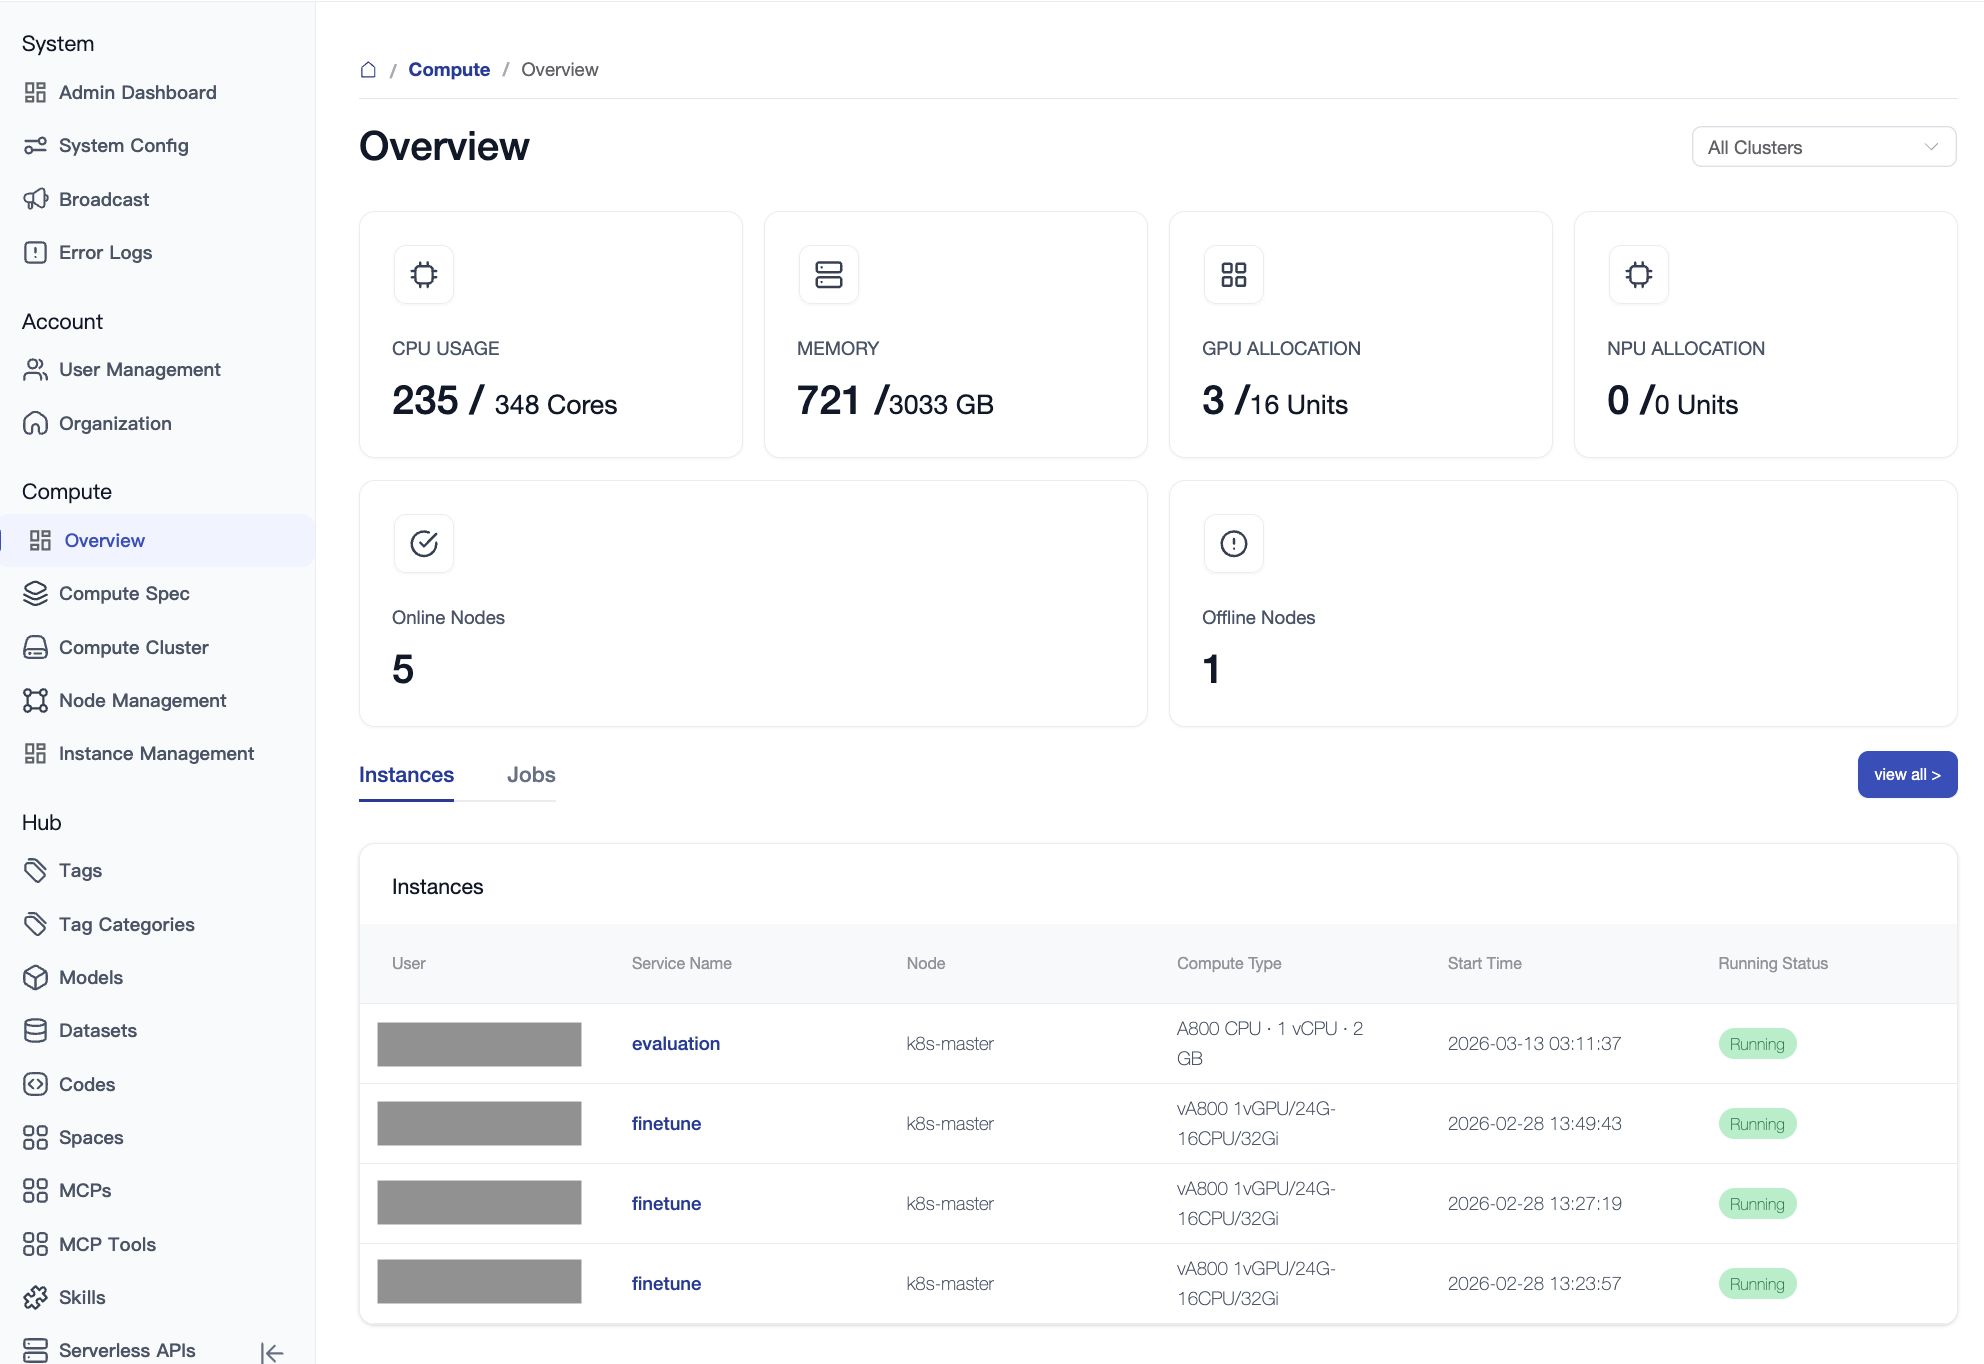
The Overview page is the "health dashboard" for global computing power, providing an intuitive display of real-time resource utilization and system status.
- Multi-dimensional Display: Supports filtering by the entire region or individual zones (data centers).
- Core Metrics:
- Total Cluster Resources: Real-time statistics of total CPU, Memory, GPU, and NPU.
- Real-time Utilization: Shows current resource occupancy and actual usage percentage.
- Node Health: Monitors the number of online, offline, and under-maintenance nodes.
- Pending Jobs: Real-time tracking of job queuing status.
2. Resource SKU
Resource SKU defines the "menu templates" when users apply for resources, mapping underlying resource request parameters to easy-to-understand specification names.
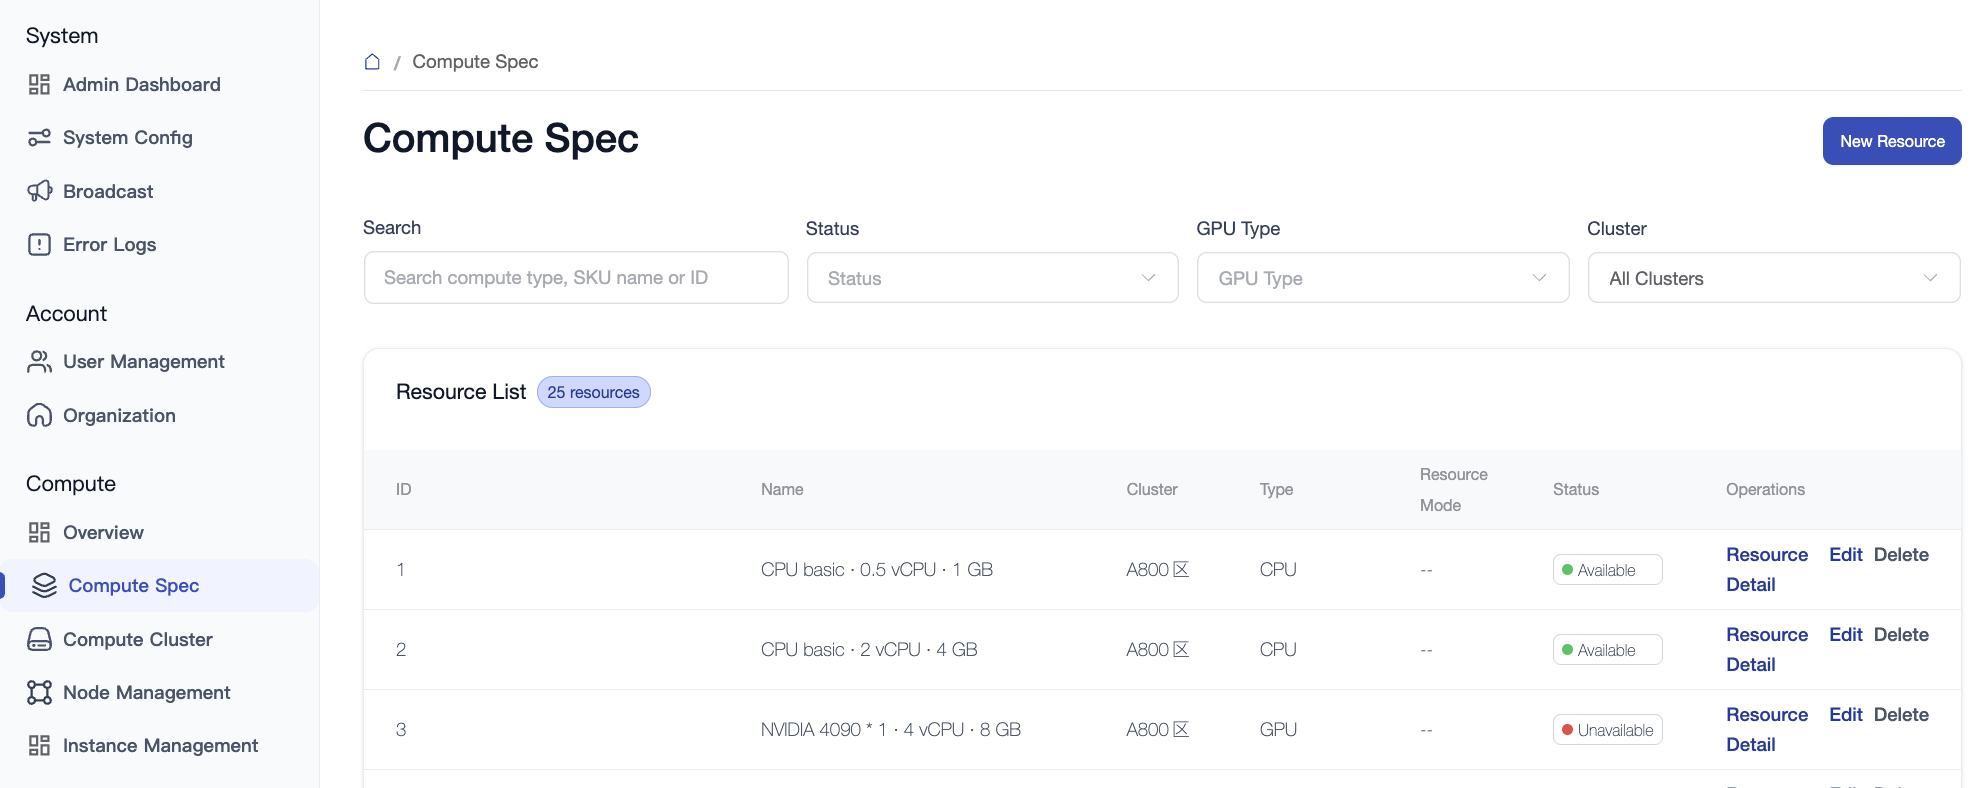
2.1 SKU List
Displays the currently defined computing power packages, including the following key fields:
- ID / Name: Unique identifier and display name for the specification.
- Type / Status: Resource category and current availability.
- Virtualization: Indicates whether the specification is a virtualized resource.
- Operations: Supports adding new specifications, editing configurations, deleting, and viewing details.
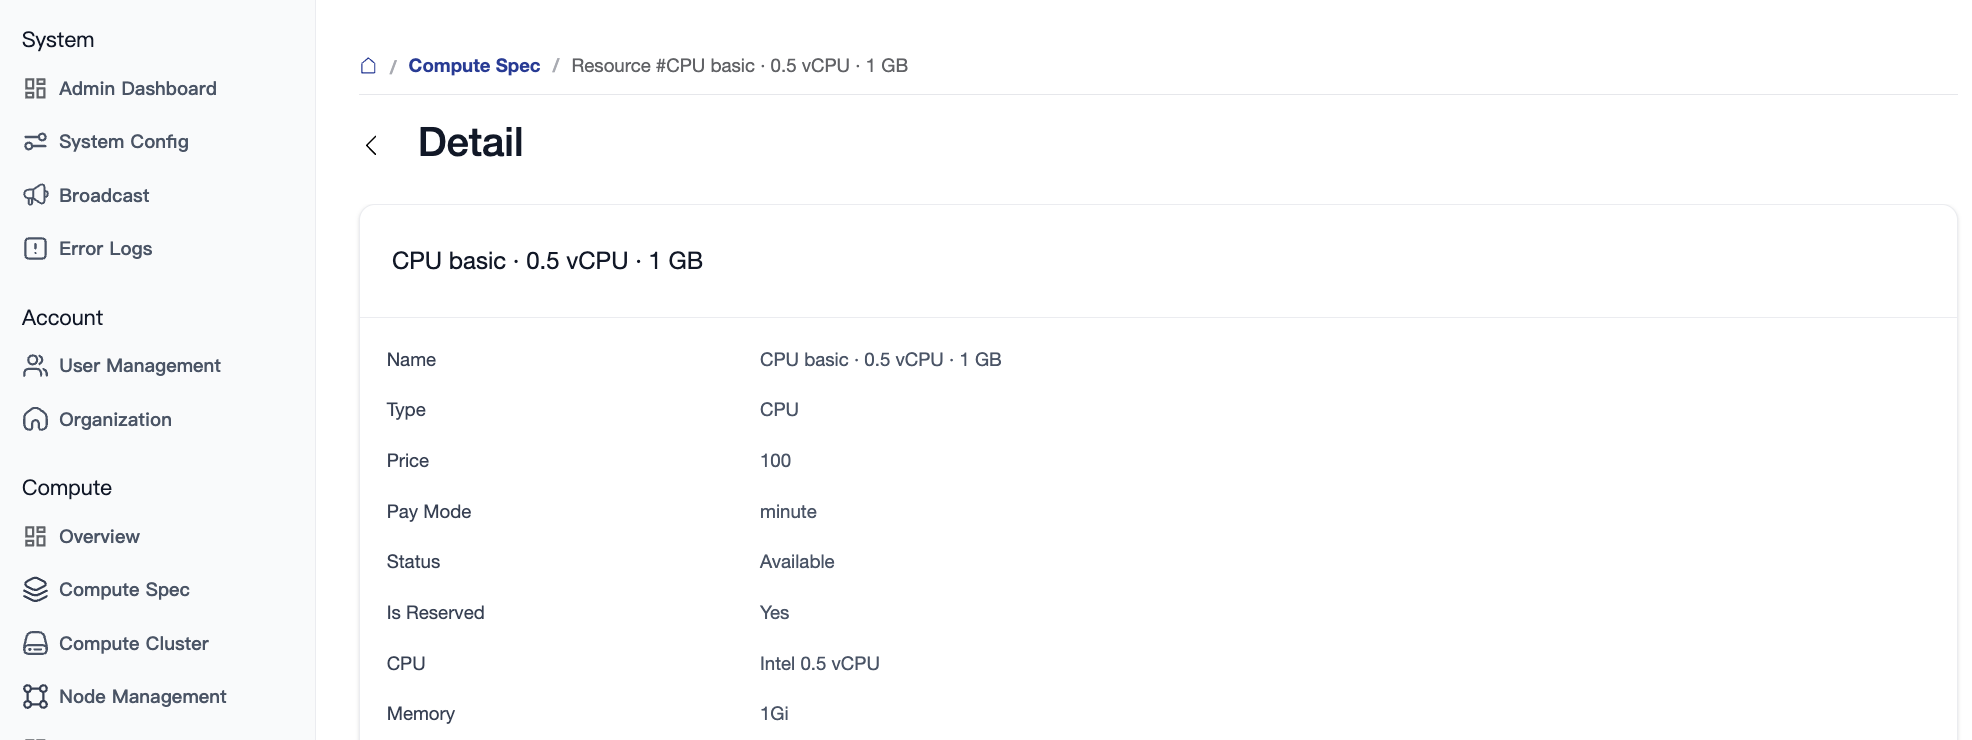
2.2 SKU Details
On the details page, administrators can view the specific resource parameters associated with the specification (such as limited CPU cores, memory size, and specific GPU allocation rules).
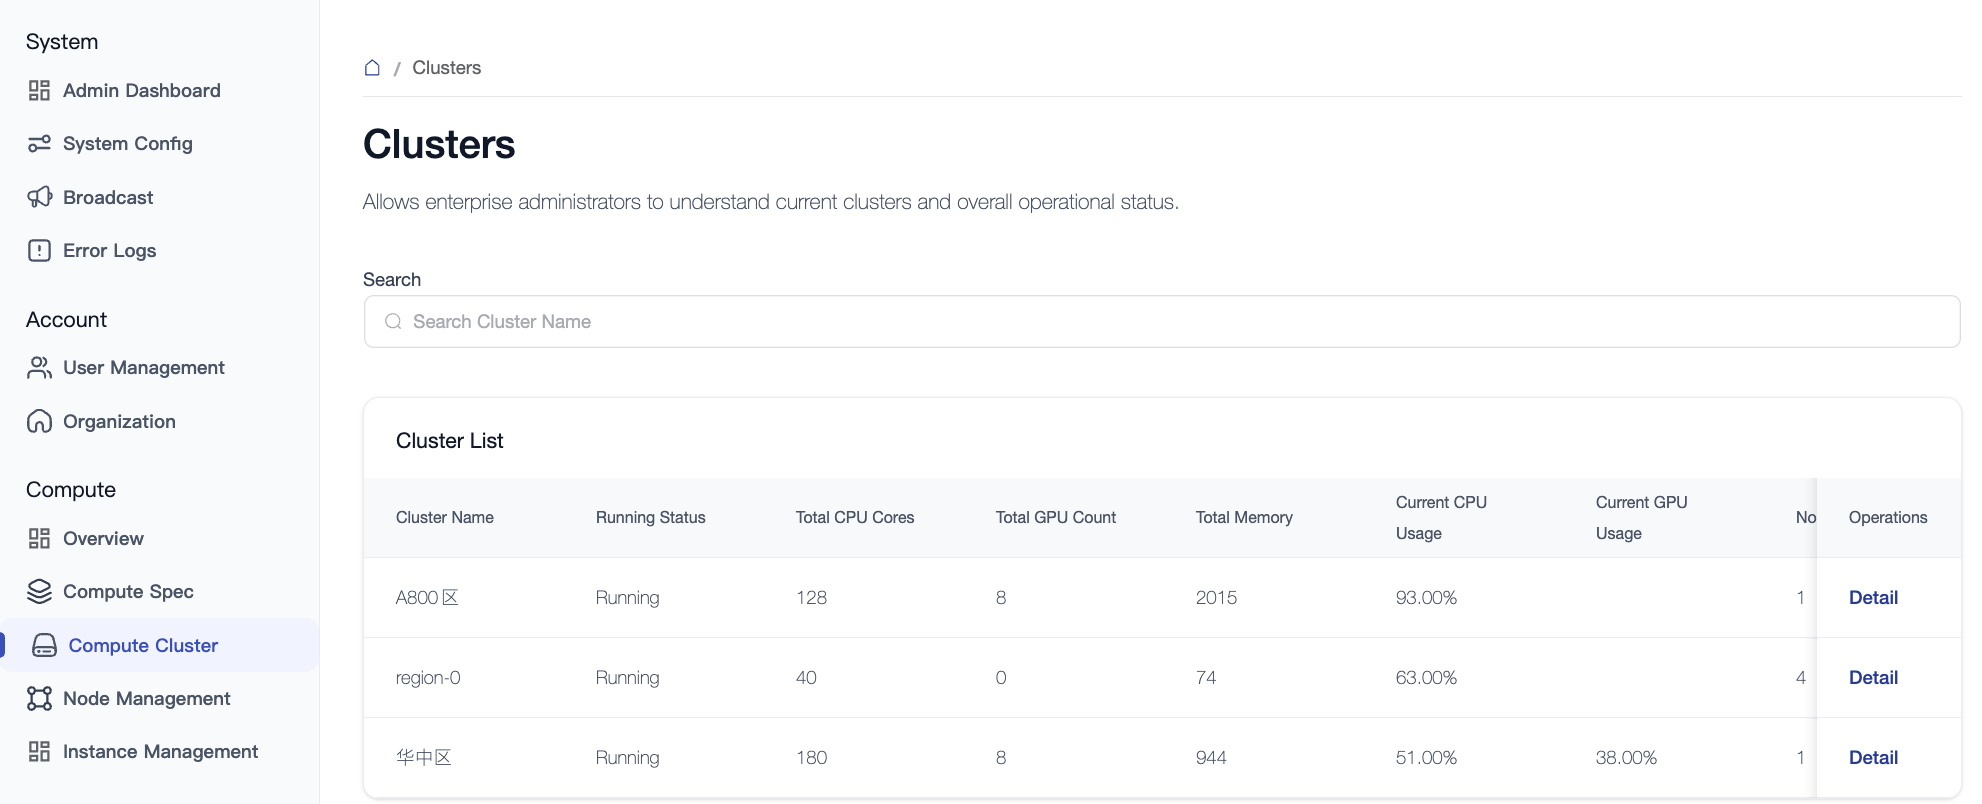
3. Cluster Management
Clusters are the highest management units for computing resources, typically representing physical geographic partitions (e.g., "Beijing Data Center", "Shanghai Data Center") or logical business isolation domains (e.g., "Training Center", "Inference Center").
- Management Operations: Supports CRUD (Create, Read, Update, Delete) operations for clusters.
- Node Details: Jump directly from the cluster details page to the management list for all nodes belonging to that cluster.
4. Node Management
Nodes are the smallest physical units of computing power, corresponding to actual physical servers.
4.1 Node List
Provides batch monitoring and operations for physical servers:
- Quick Filtering: Supports filtering by cluster name or GPU model.
- Key Fields:
- Status Monitoring: Includes "Normal", "Abnormal", and "Scheduling Blocked".
- Resource Load: Intuitive display of VRAM occupancy, GPU utilization, CPU/Memory occupancy, and the number of currently running tasks.
- Hardware Description: e.g.,
8 x Nvidia A100 80G.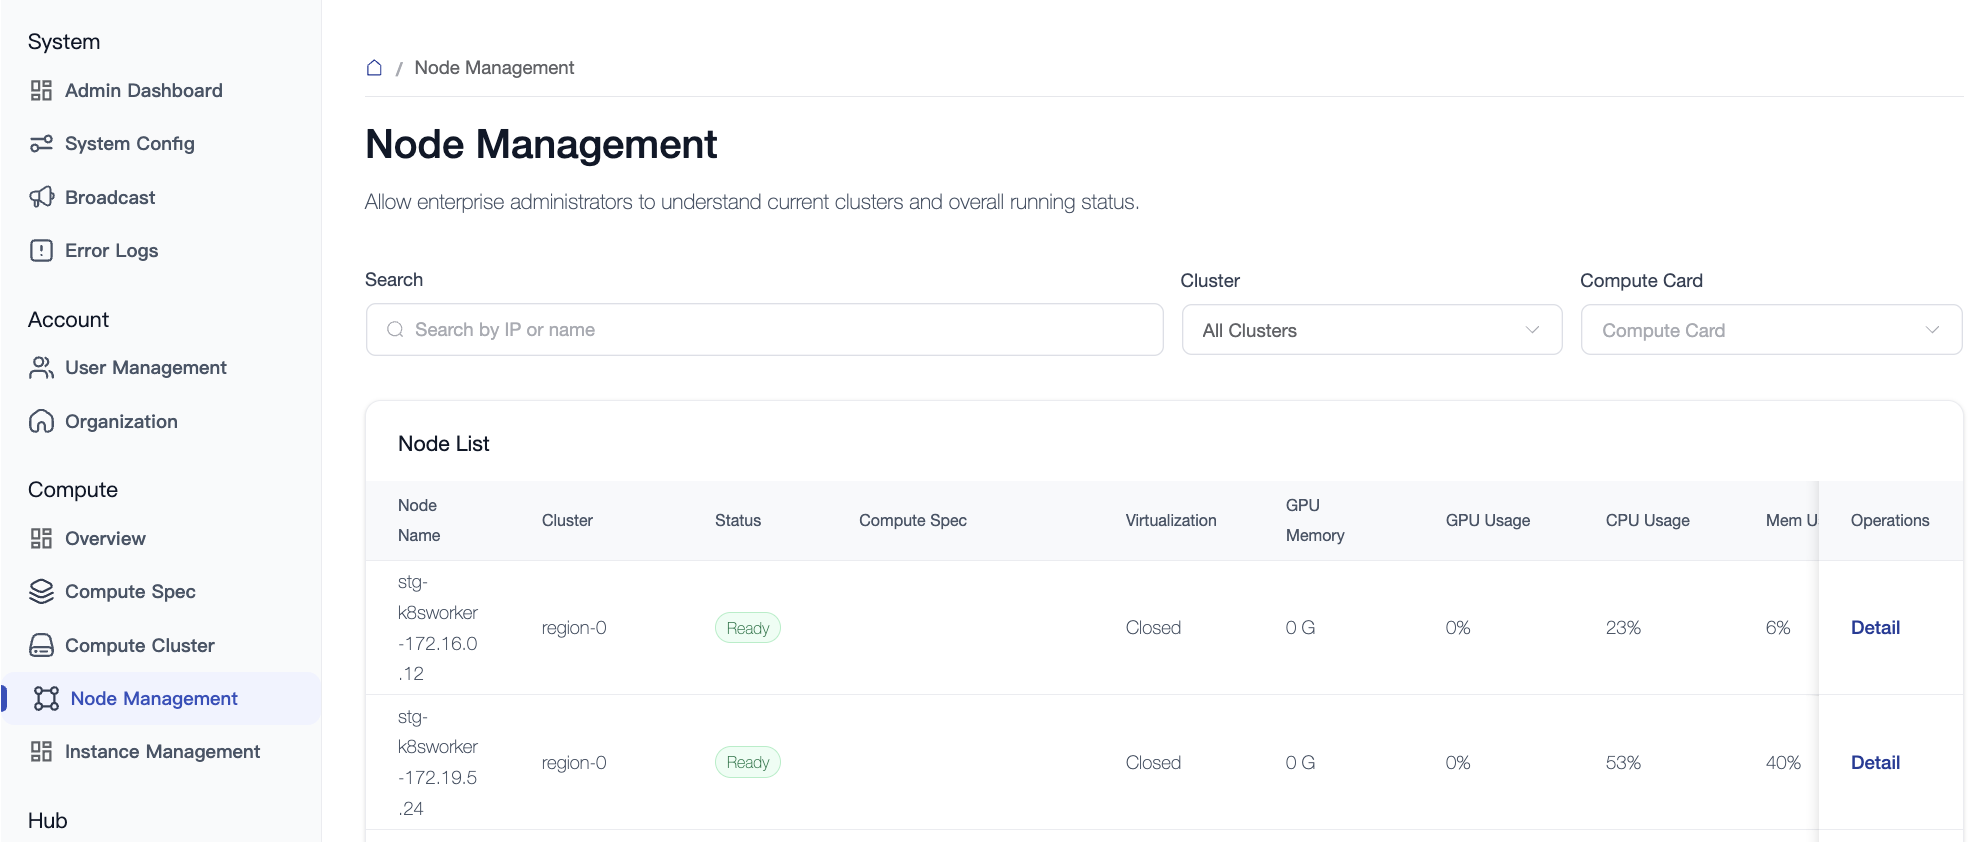
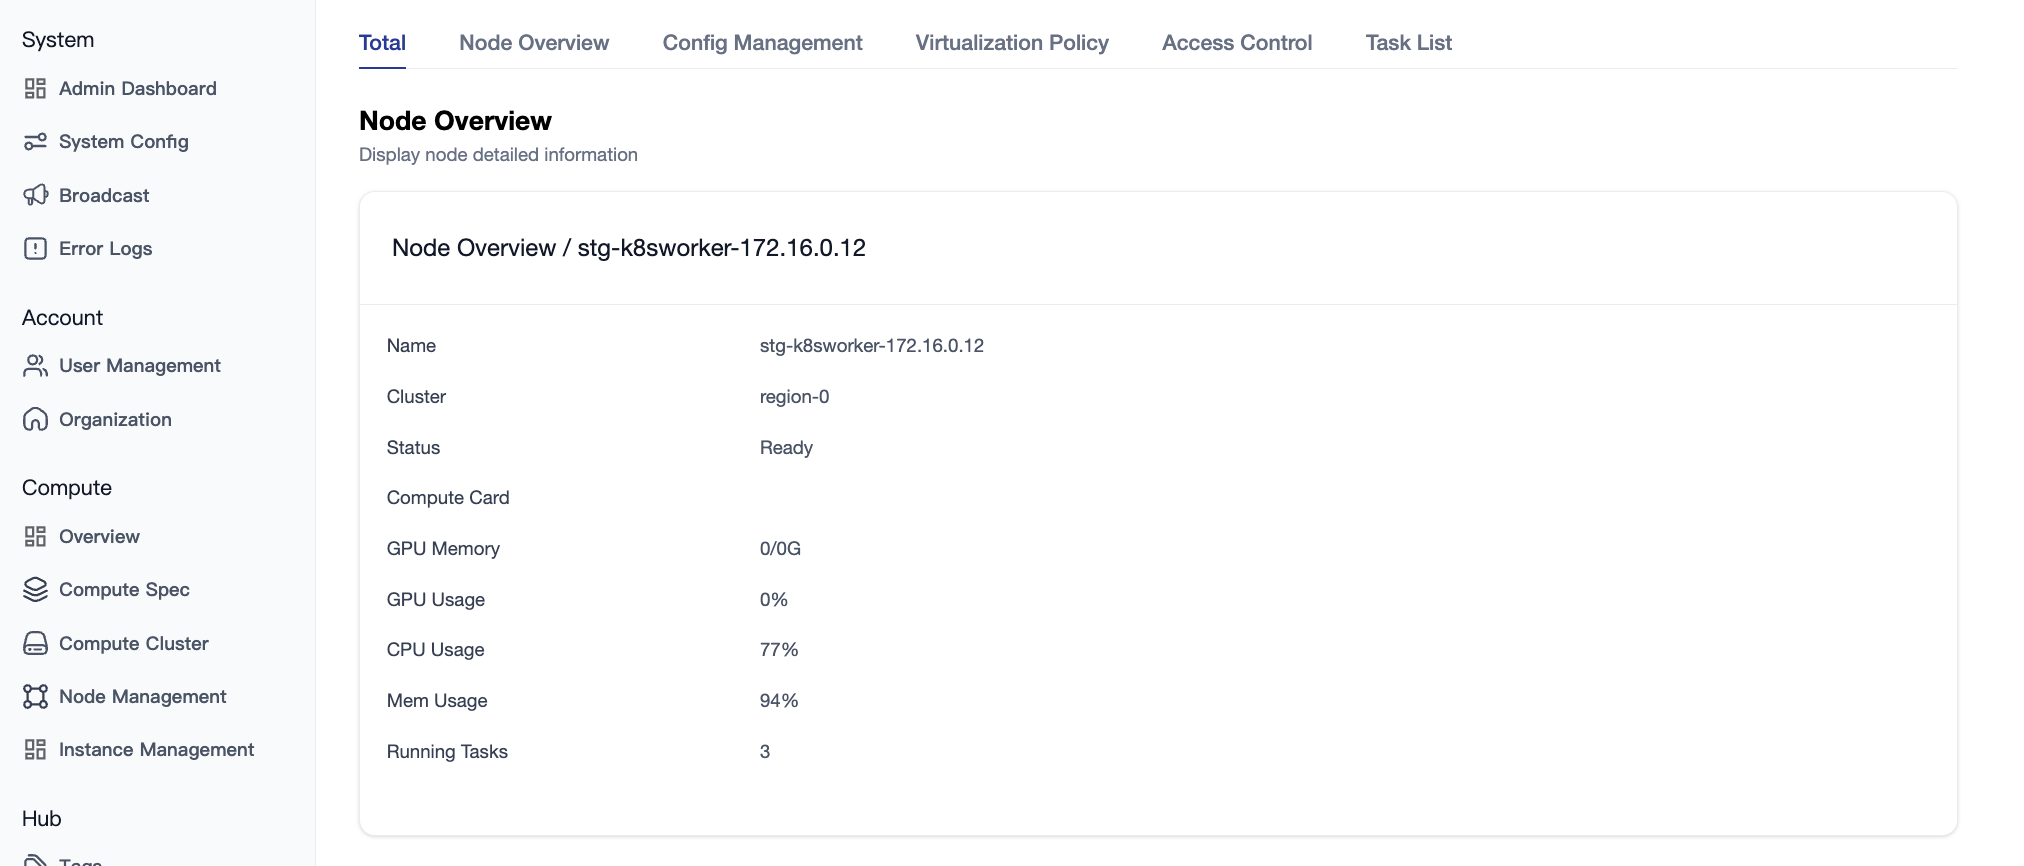
4.2 Node Details and Configuration
4.2.1 Node Overview
Displays basic node information, resource usage, task running status, and GPU resource distribution.
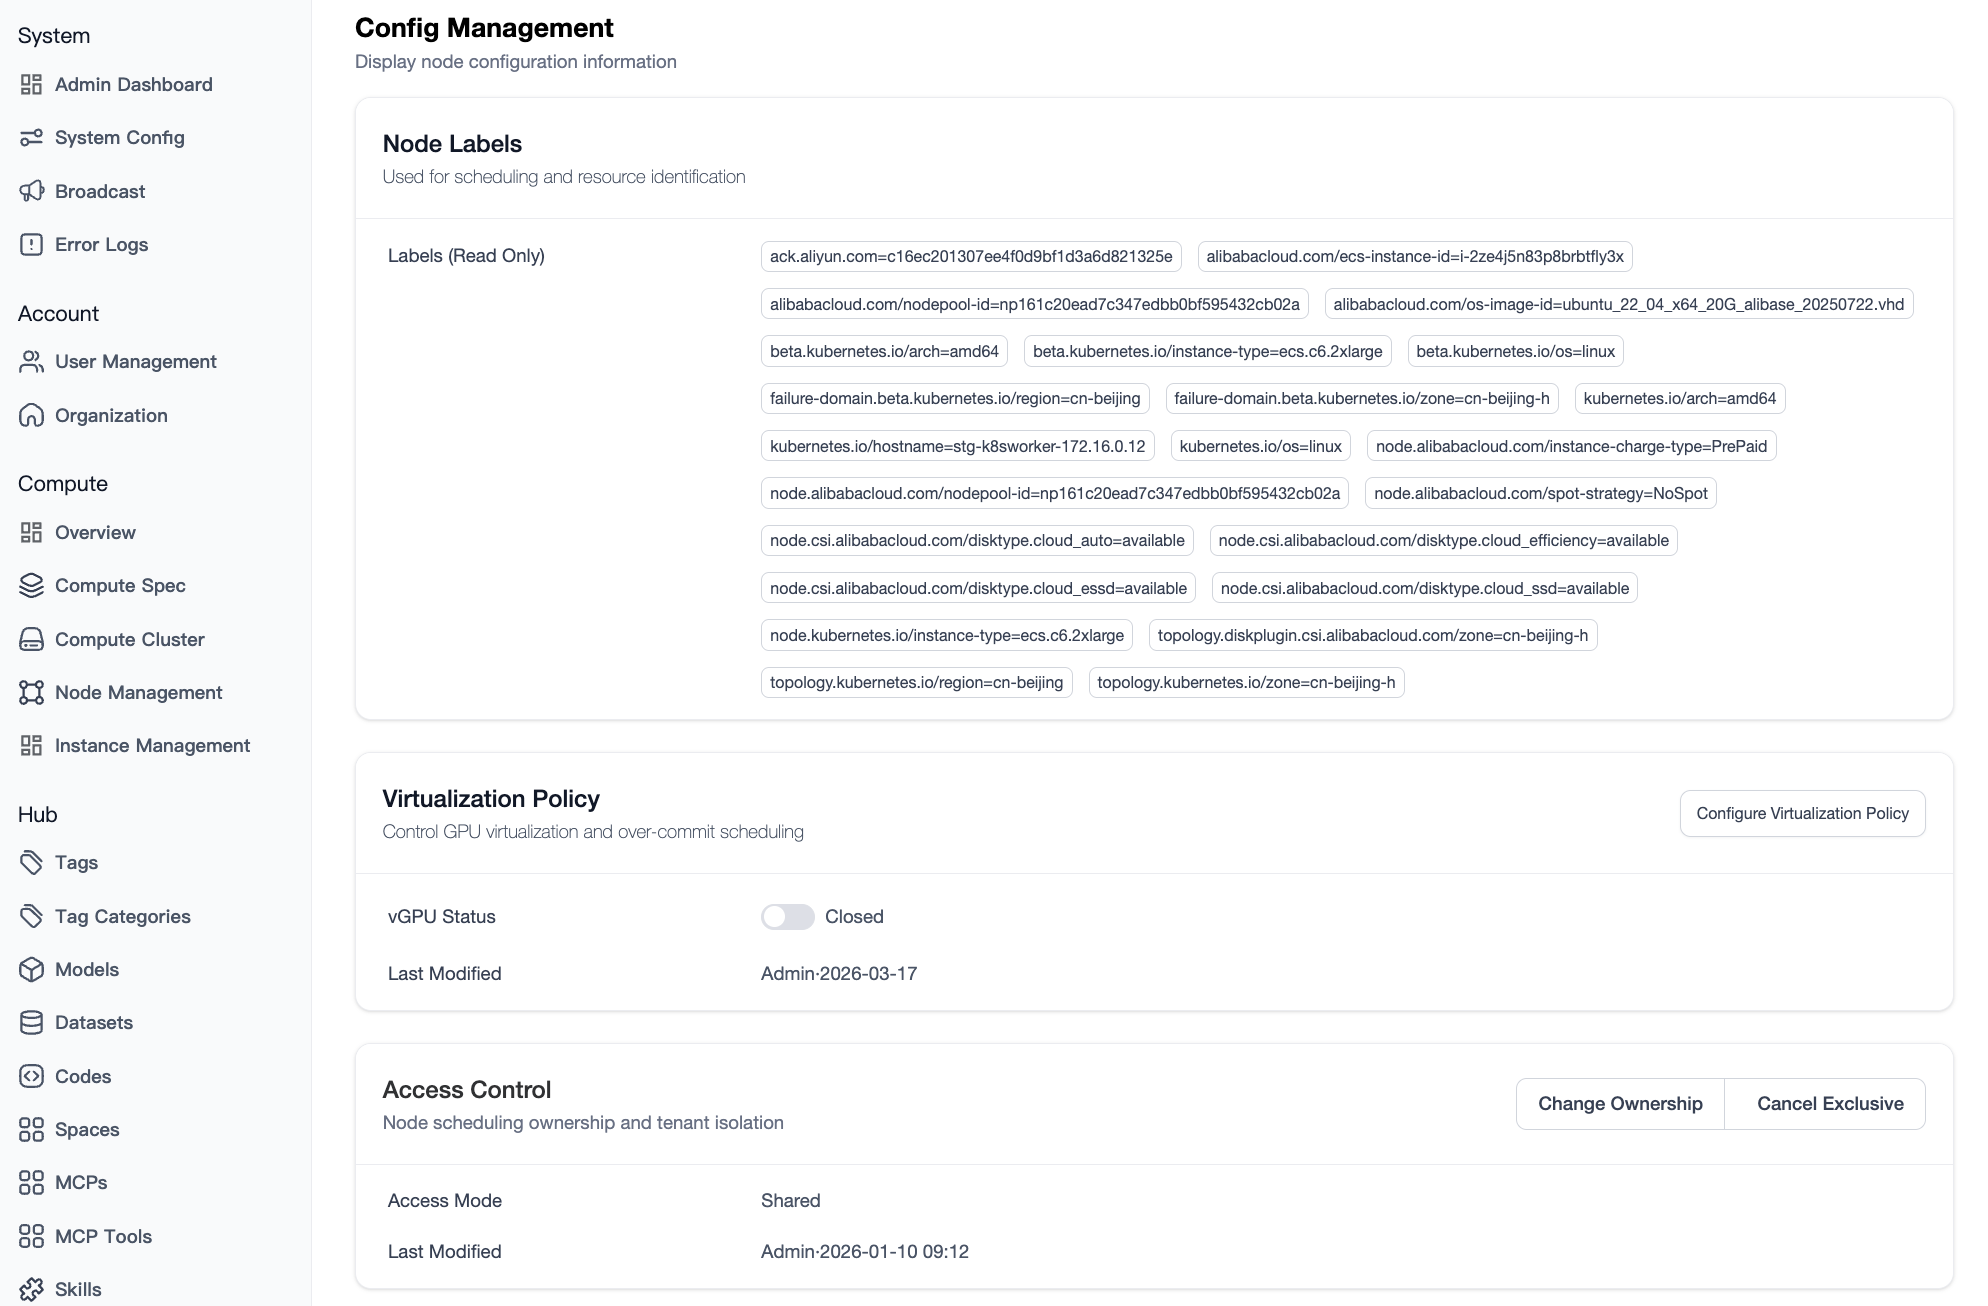
4.2.2 Node Configuration and Policies
- Tag Management:
- System Tags: Automatically identifies and displays critical metadata such as GPU model and driver version.
- User Tags: Supports custom Key-Value pairs for use with advanced scheduling strategies.
- Virtualization Policy:
- Supports software virtualization toggle configurations (e.g., HAMi).
- Access Control:
- Mode Switching: Supports "Public Shared" and "Tenant Exclusive".
- Exclusive Settings: Specify a target organization or user. The system will automatically ensure resource isolation via Taints.
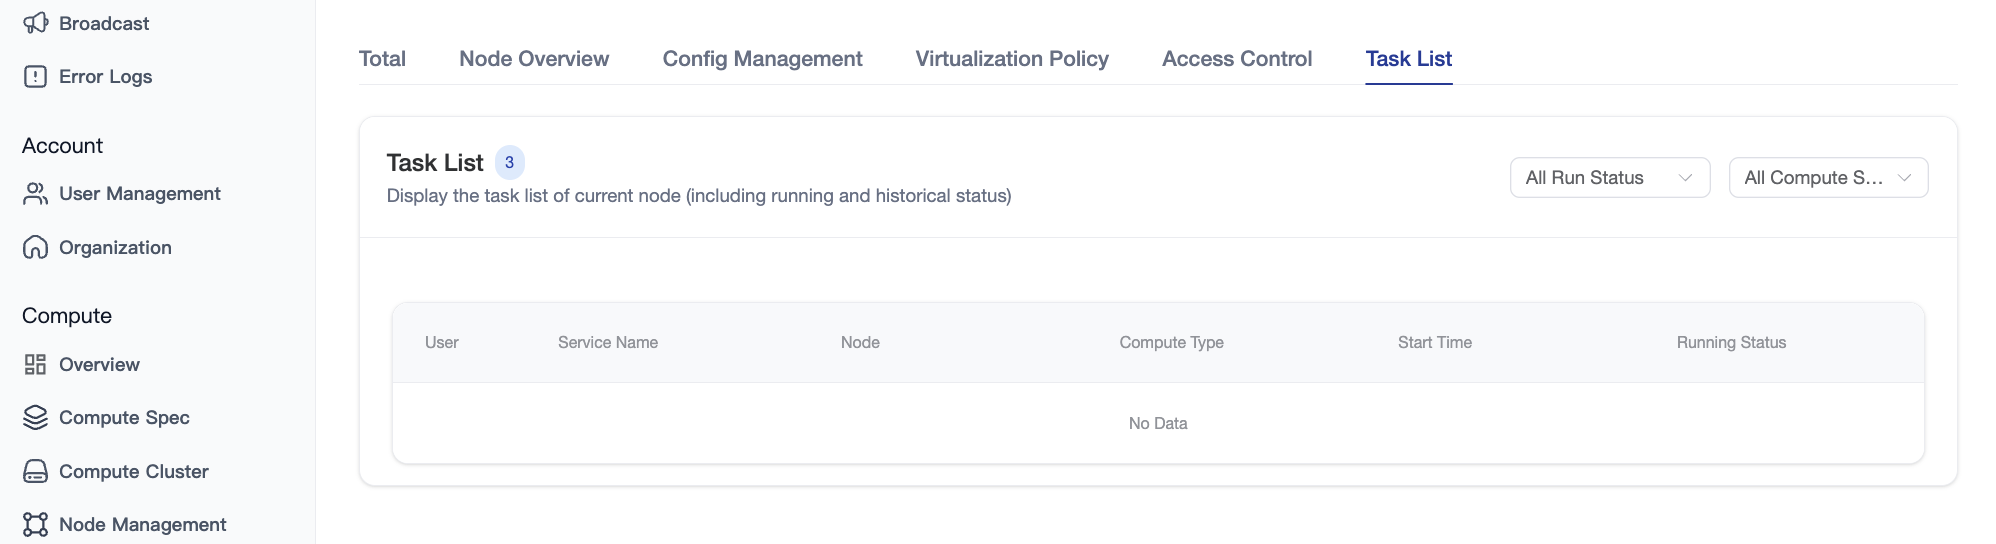
4.2.3 Task List
Displays all tasks (running and historical) hosted on the node, including user, service name, resource specification, runtime duration, and resource occupancy details.
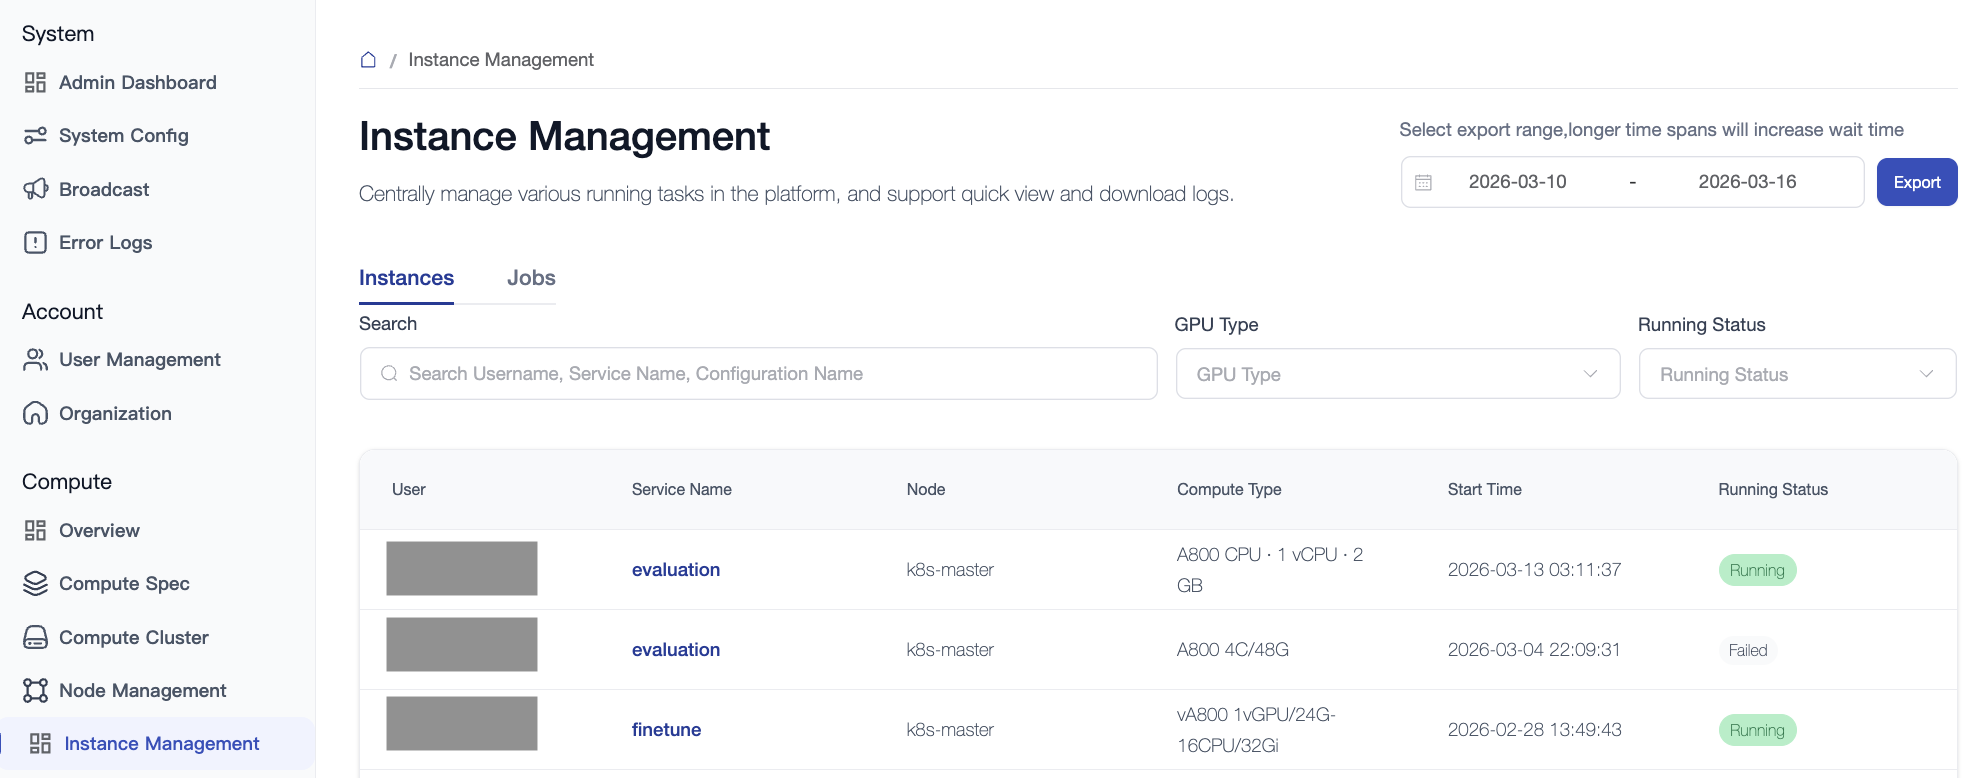
5. Instance and Job Management
5.1 Instance Management
Applicable to long-running instances such as Notebooks, online inference, and fine-tuning.
- Monitoring Interaction: Supports log snapshot functionality, allowing administrators to view the last 100 lines of logs or download the complete log file.
- Management Intervention: Administrators have the authority to start or stop abnormal instances (note the billing implications).
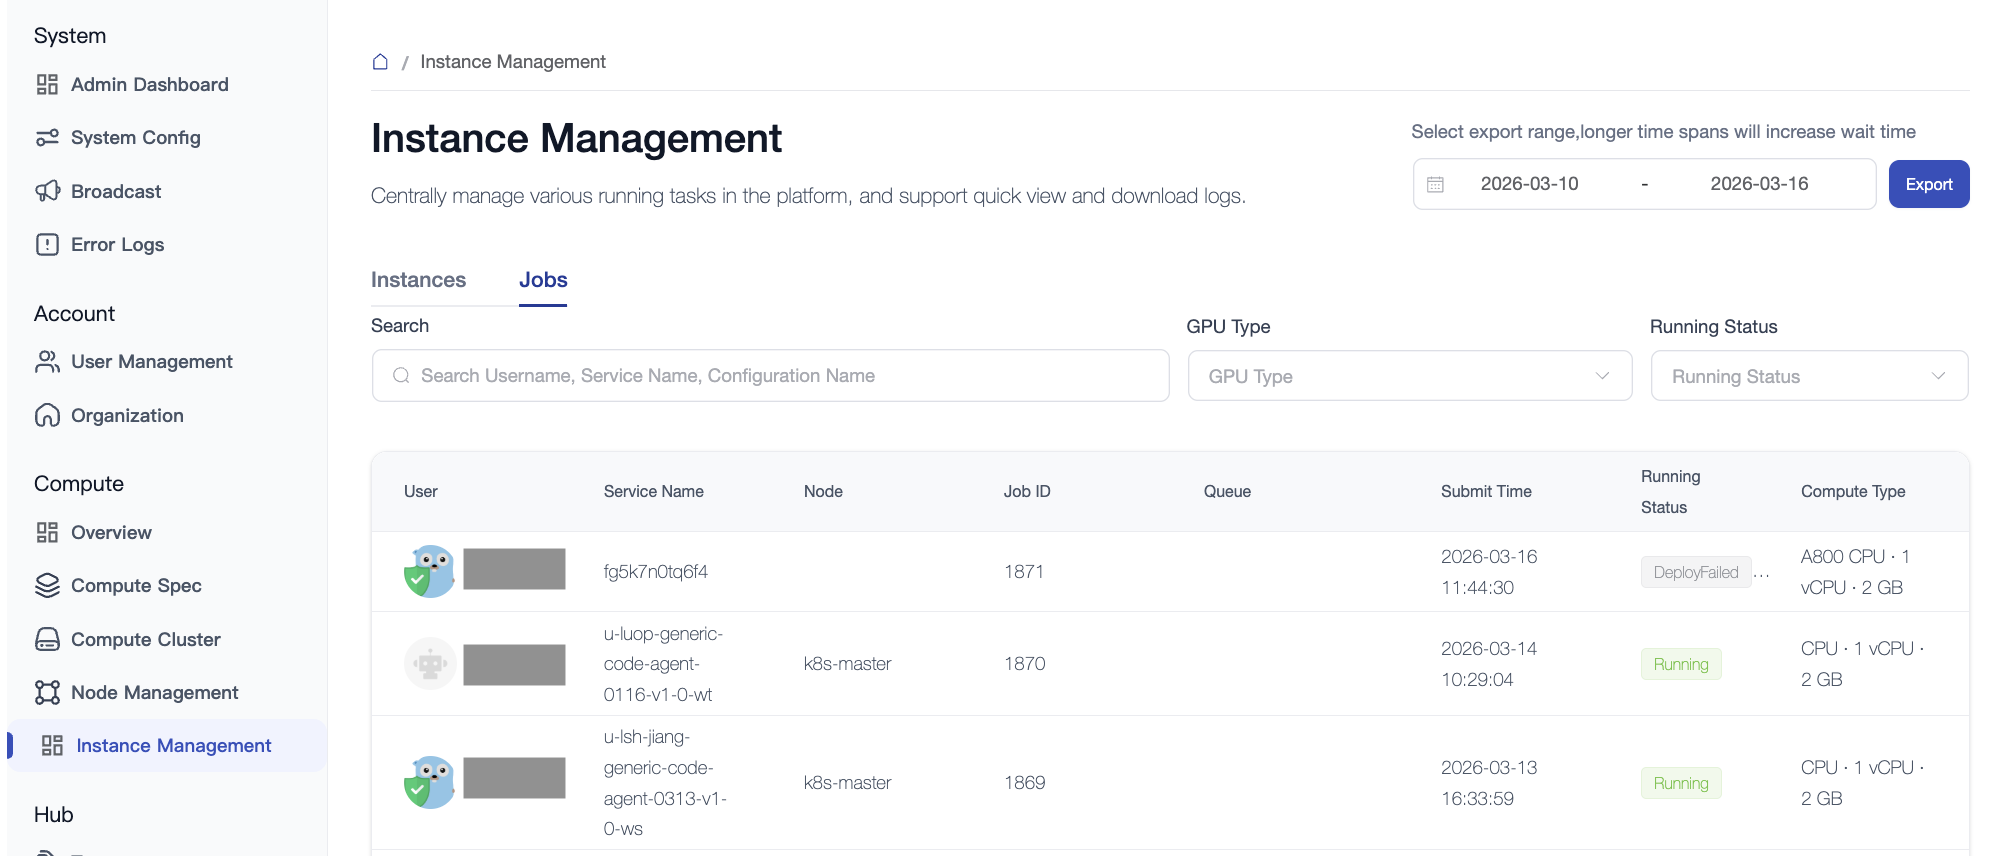
5.2 Job Management
Applicable to offline tasks such as model evaluation, offline fine-tuning, and data processing.
- Queue Scheduling: Displays job priority, assigned queue, and current status (Pending/Running/Failed/Finish).
- Maintenance Operations: Supports manual termination of abnormally occupied tasks and adjustment of priority for emergency tasks to allow "line-jumping".