Using Fine-Tuning and Status Monitoring
Once the fine-tuning instance launches successfully, click on the instance name to enter the operation console, configure parameters, and bind datasets.
Using Web Interface
If you selected a framework with a visual interface (like LLaMA-Factory) during creation, the system overview page directly presents the tuning console.
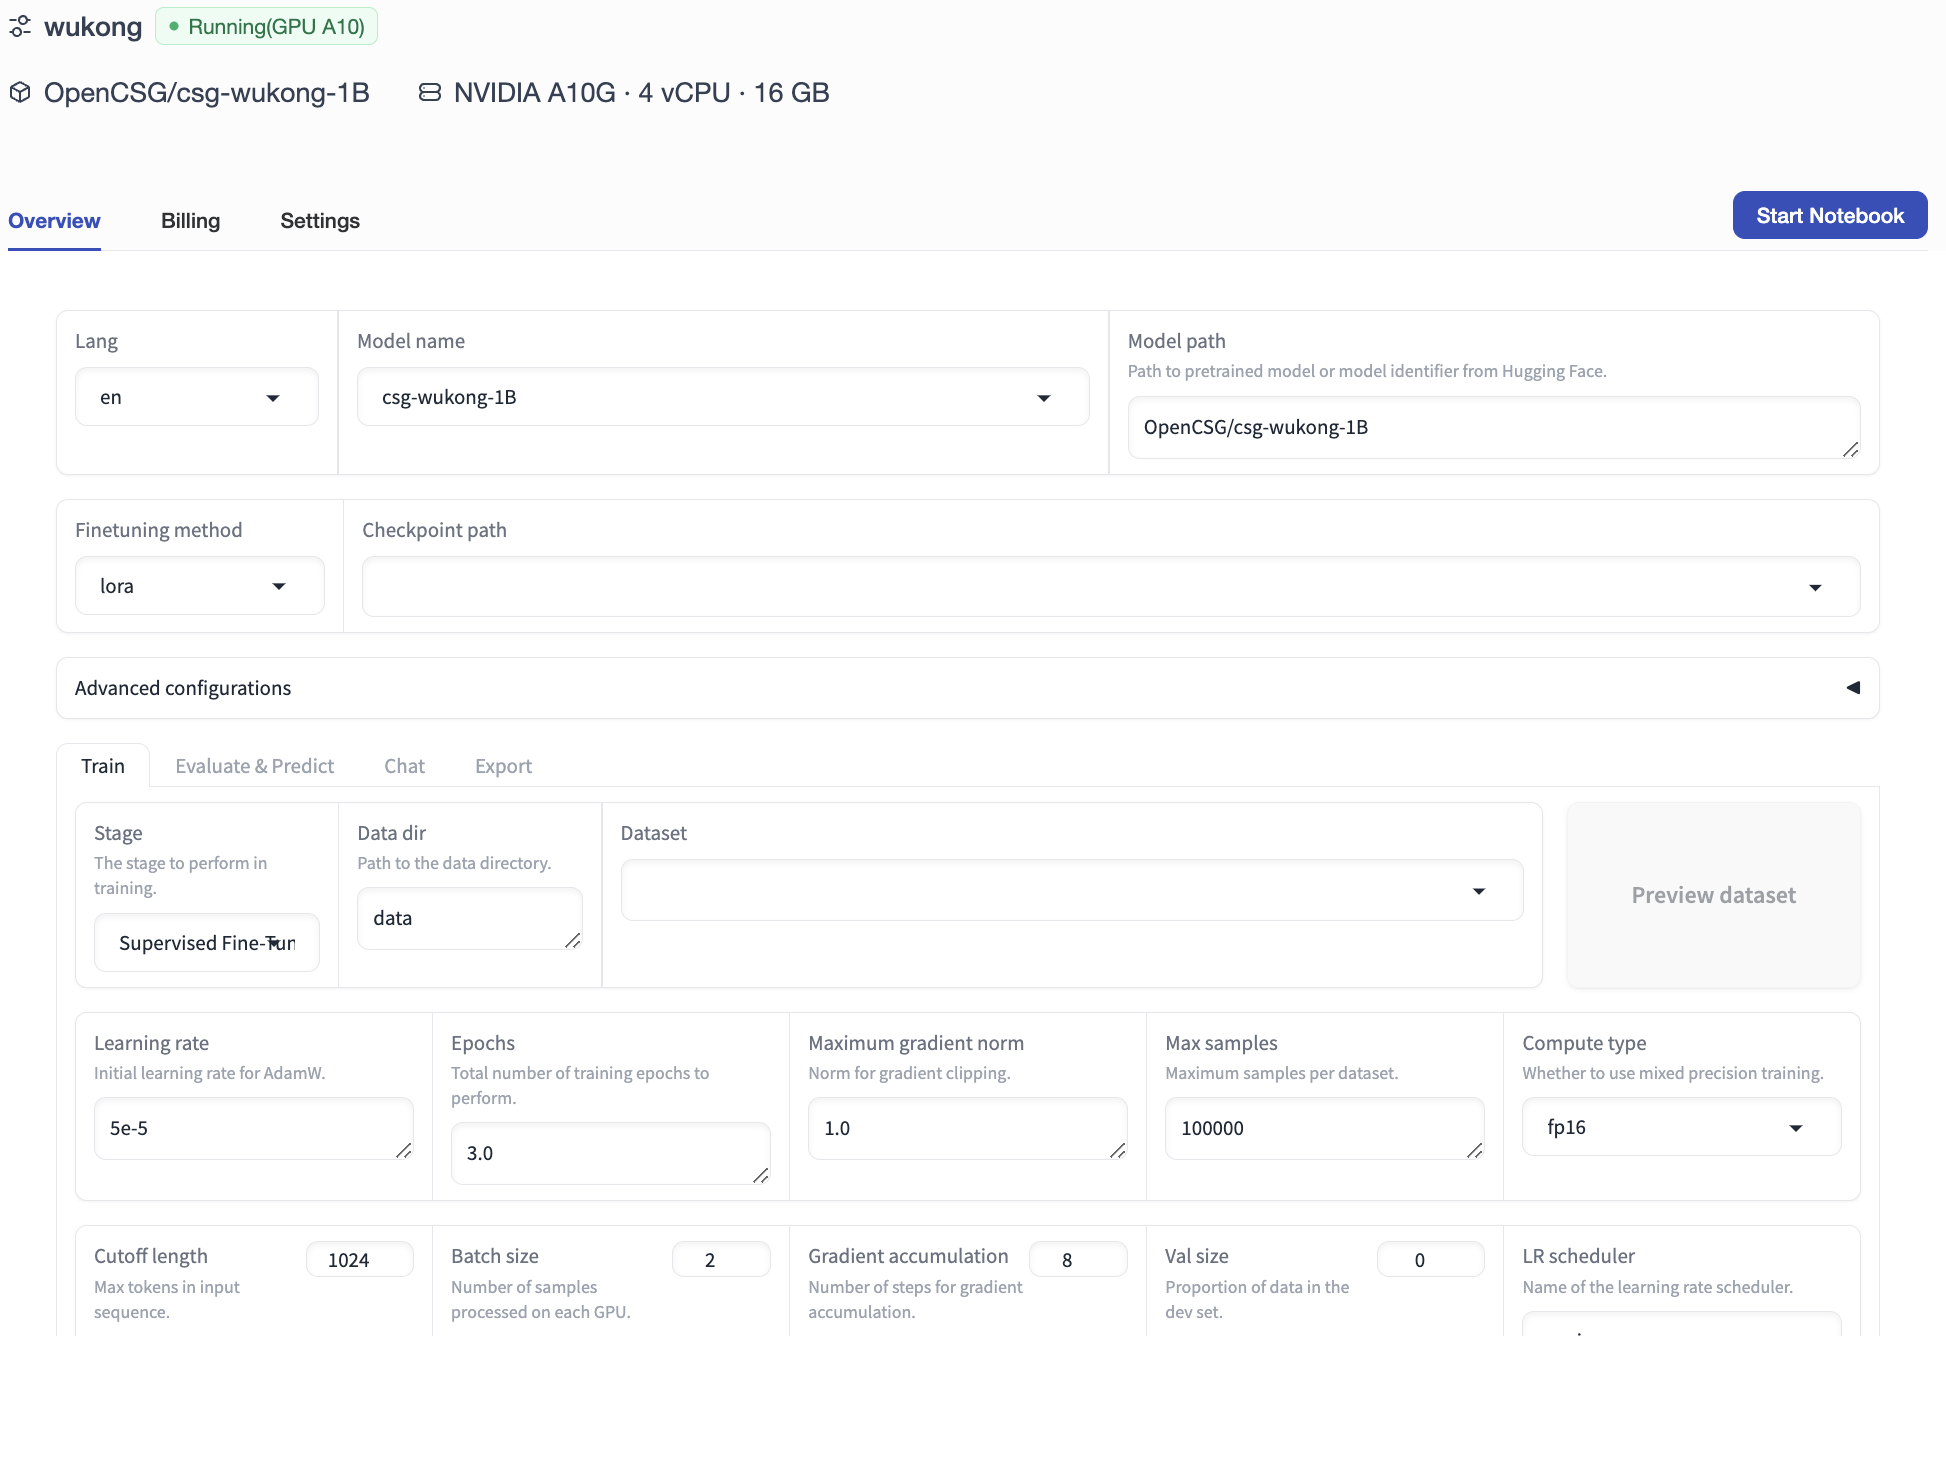
From this screen, you can:
- Load training stage configurations.
- Select dataset.
- Adjust training hyperparameters (e.g., Batch Size, Learning Rate, Epochs).
- Click [Start Fine-Tuning] at the bottom.
Using Notebook Interactive Environment
Users requiring highly customized workflows can click the [Start Notebook] button.
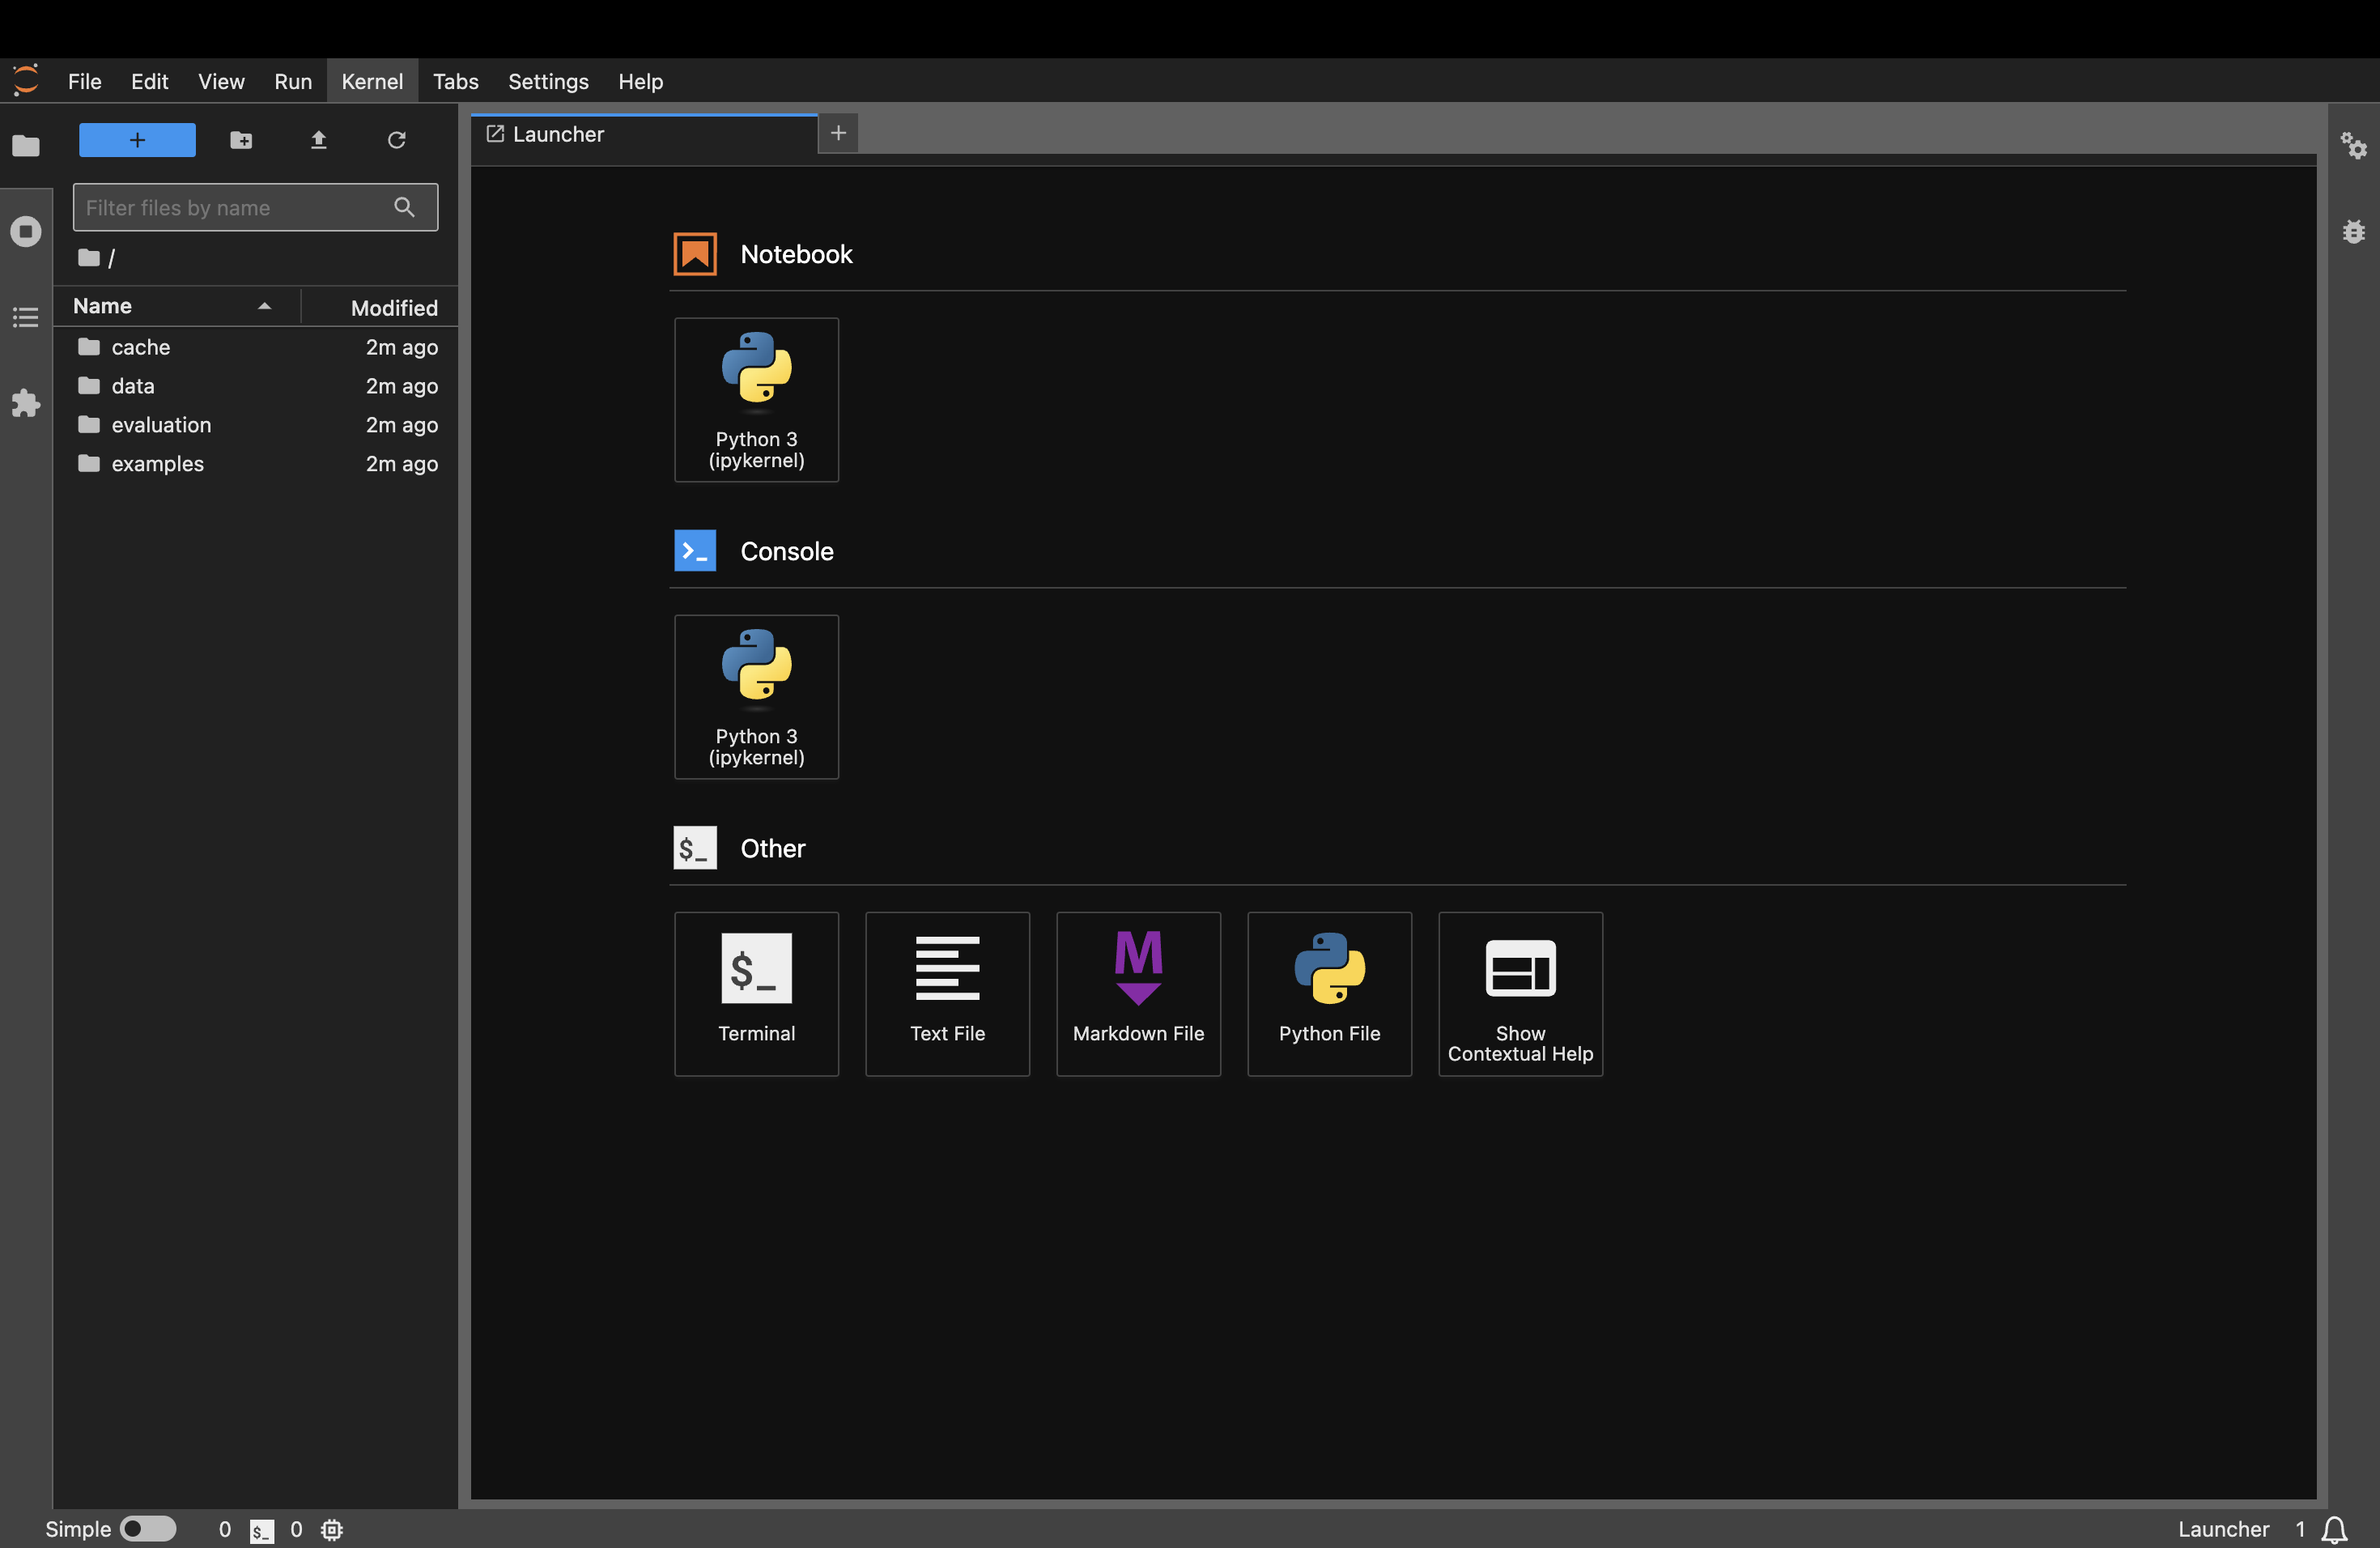
This opens a JupyterLab development environment containing deep system access, perfect for making advanced script modifications and executing validation operations.
Training Status and Analysis
Upon starting fine-tuning, you can view real-time telemetry indicators by navigating to the [Analysis] tab sequentially in the console side menu:
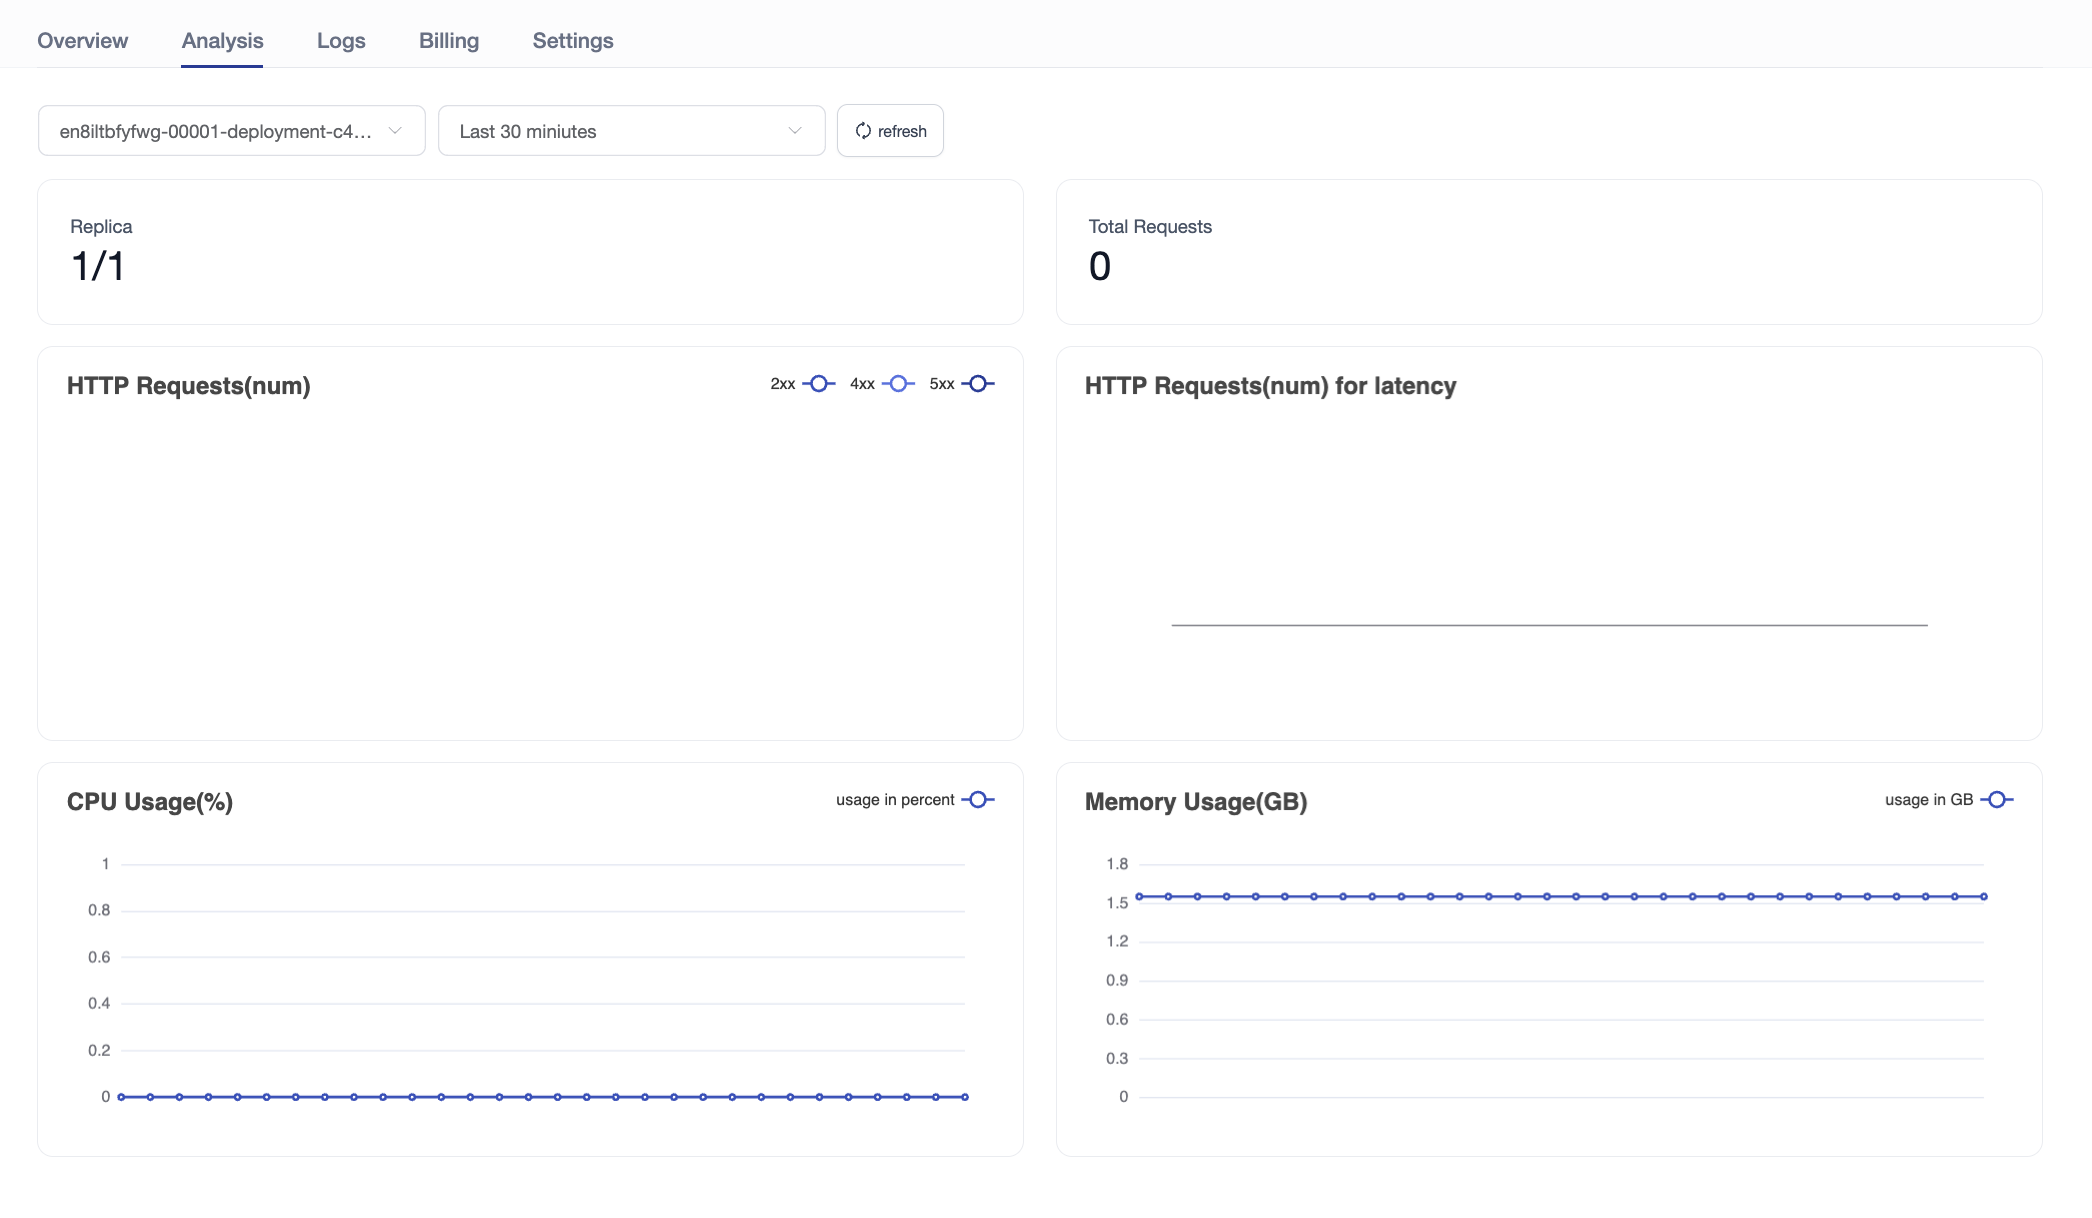
- Monitor CPU/GPU utilization across instances to assess computational load.
- Check current memory and VRAM allocation.
- Display relevant metric plots and training curves (e.g., Loss tracking).
Billing and Settlement
Resource consumption statistics and precise bills can be accessed via the [Billing] tab in the sidebar:
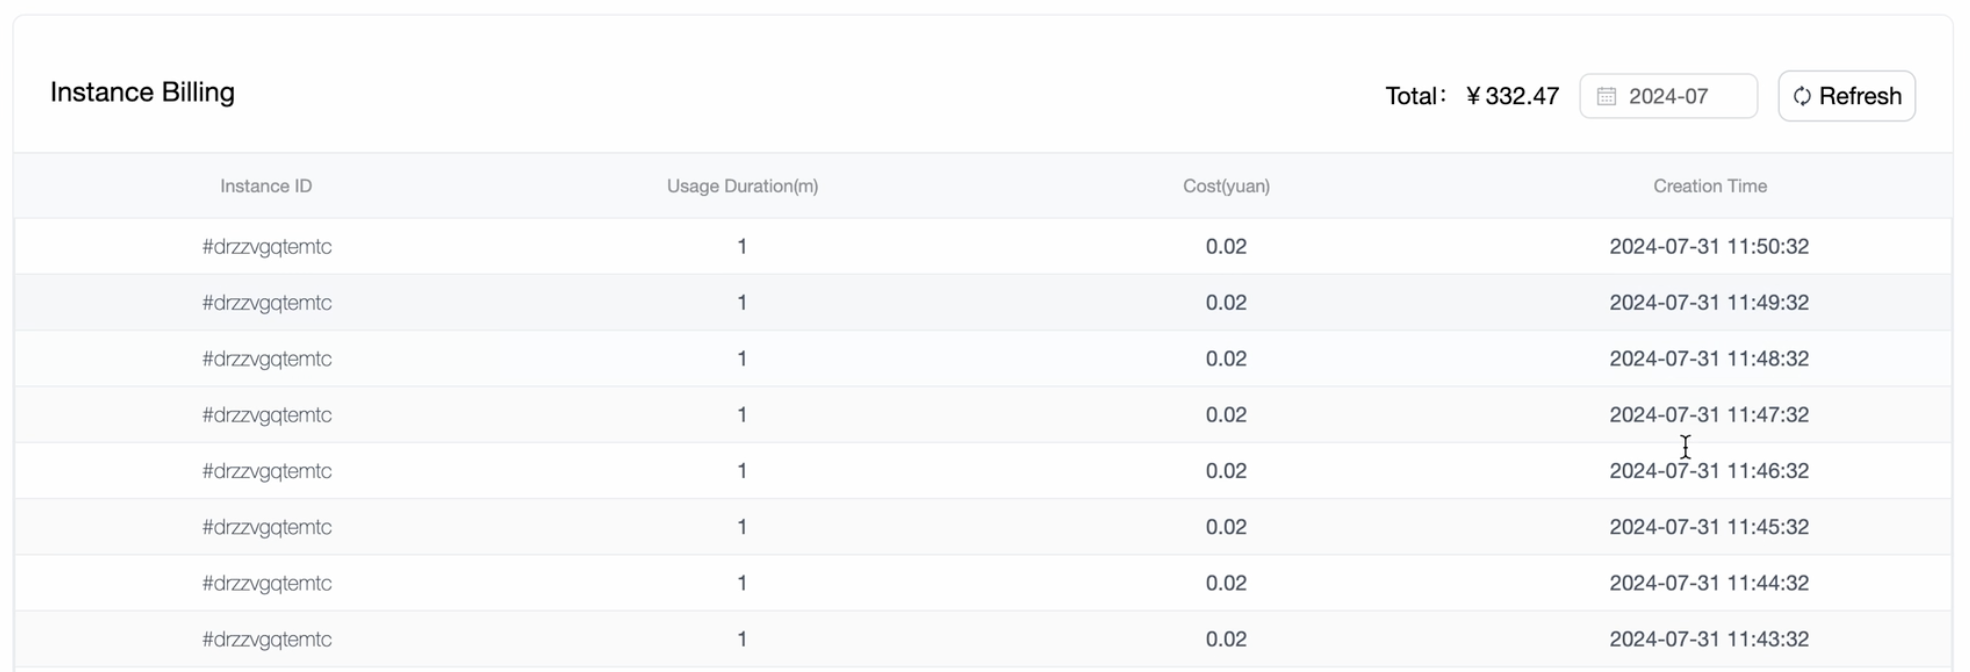
Note: Please remember to proactively stop or delete your instance in the Settings panel when all tasks are complete down to deter continuous billing costs.