Visualization Interface Operation Guide
In addition to interacting with models via the command line, CSGLite also provides an intuitive visualization Web interface, allowing users to manage models more conveniently.
How to Open the Interface
Run the following command in the terminal to start the visualization service:
# Start visualization interface
csghub-lite serve
Upon successful startup, you will see output information similar to the following:
csghub-lite server listening on :11435
  Web UI:     http://localhost:11435/
  Ollama API: http://localhost:11435/api/chat
  OpenAI API: http://localhost:11435/v1/chat/completions
At this point, simply visit http://localhost:11435/ in your browser to enter the visualization operation interface.
Core Sections
The entire UI is divided into nine core functional areas:
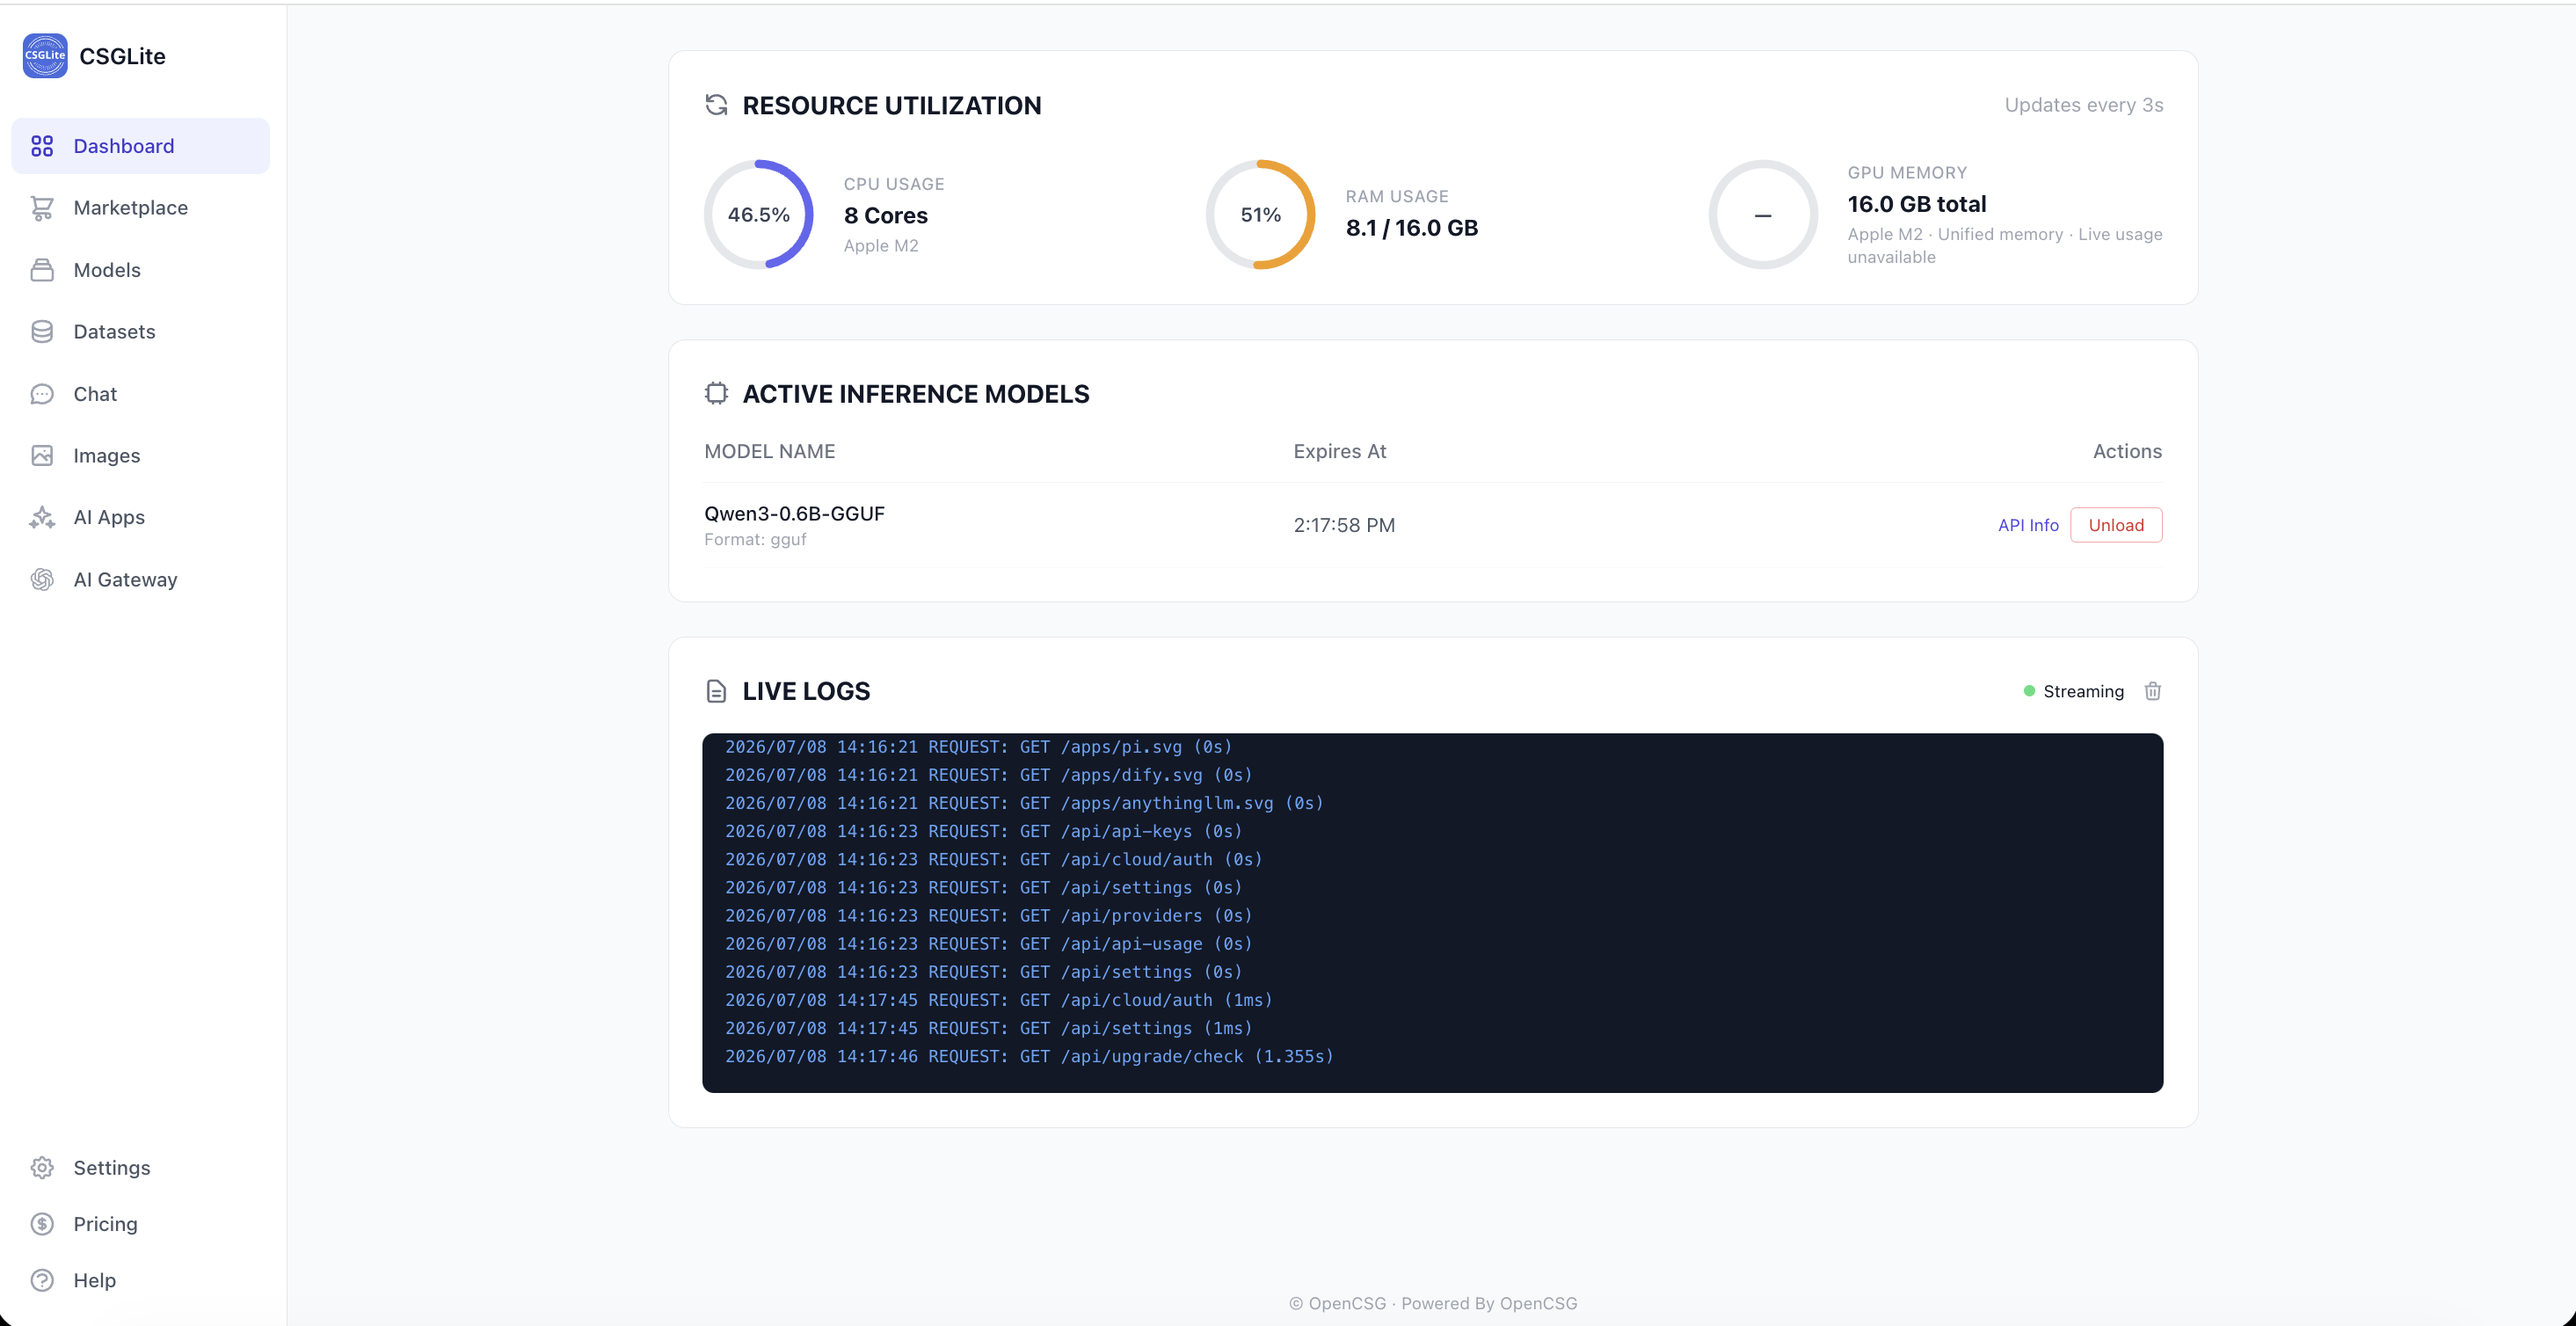
1. Dashboard - Real-time Operation Monitoring
This is the default page after opening, displaying the system's "health status" and current inference tasks.
- Resource Usage Cards: Real-time monitoring of CPU usage, RAM memory usage, and GPU VRAM usage.
- Running Models List: Lists model names and loading durations in a table.
- Action Items: Provides [Unload] (stop and unload the model from memory) and [API Call] (view the API address of the model) operations.
- Live Logs: The area below displays scrolling logs for the selected model.
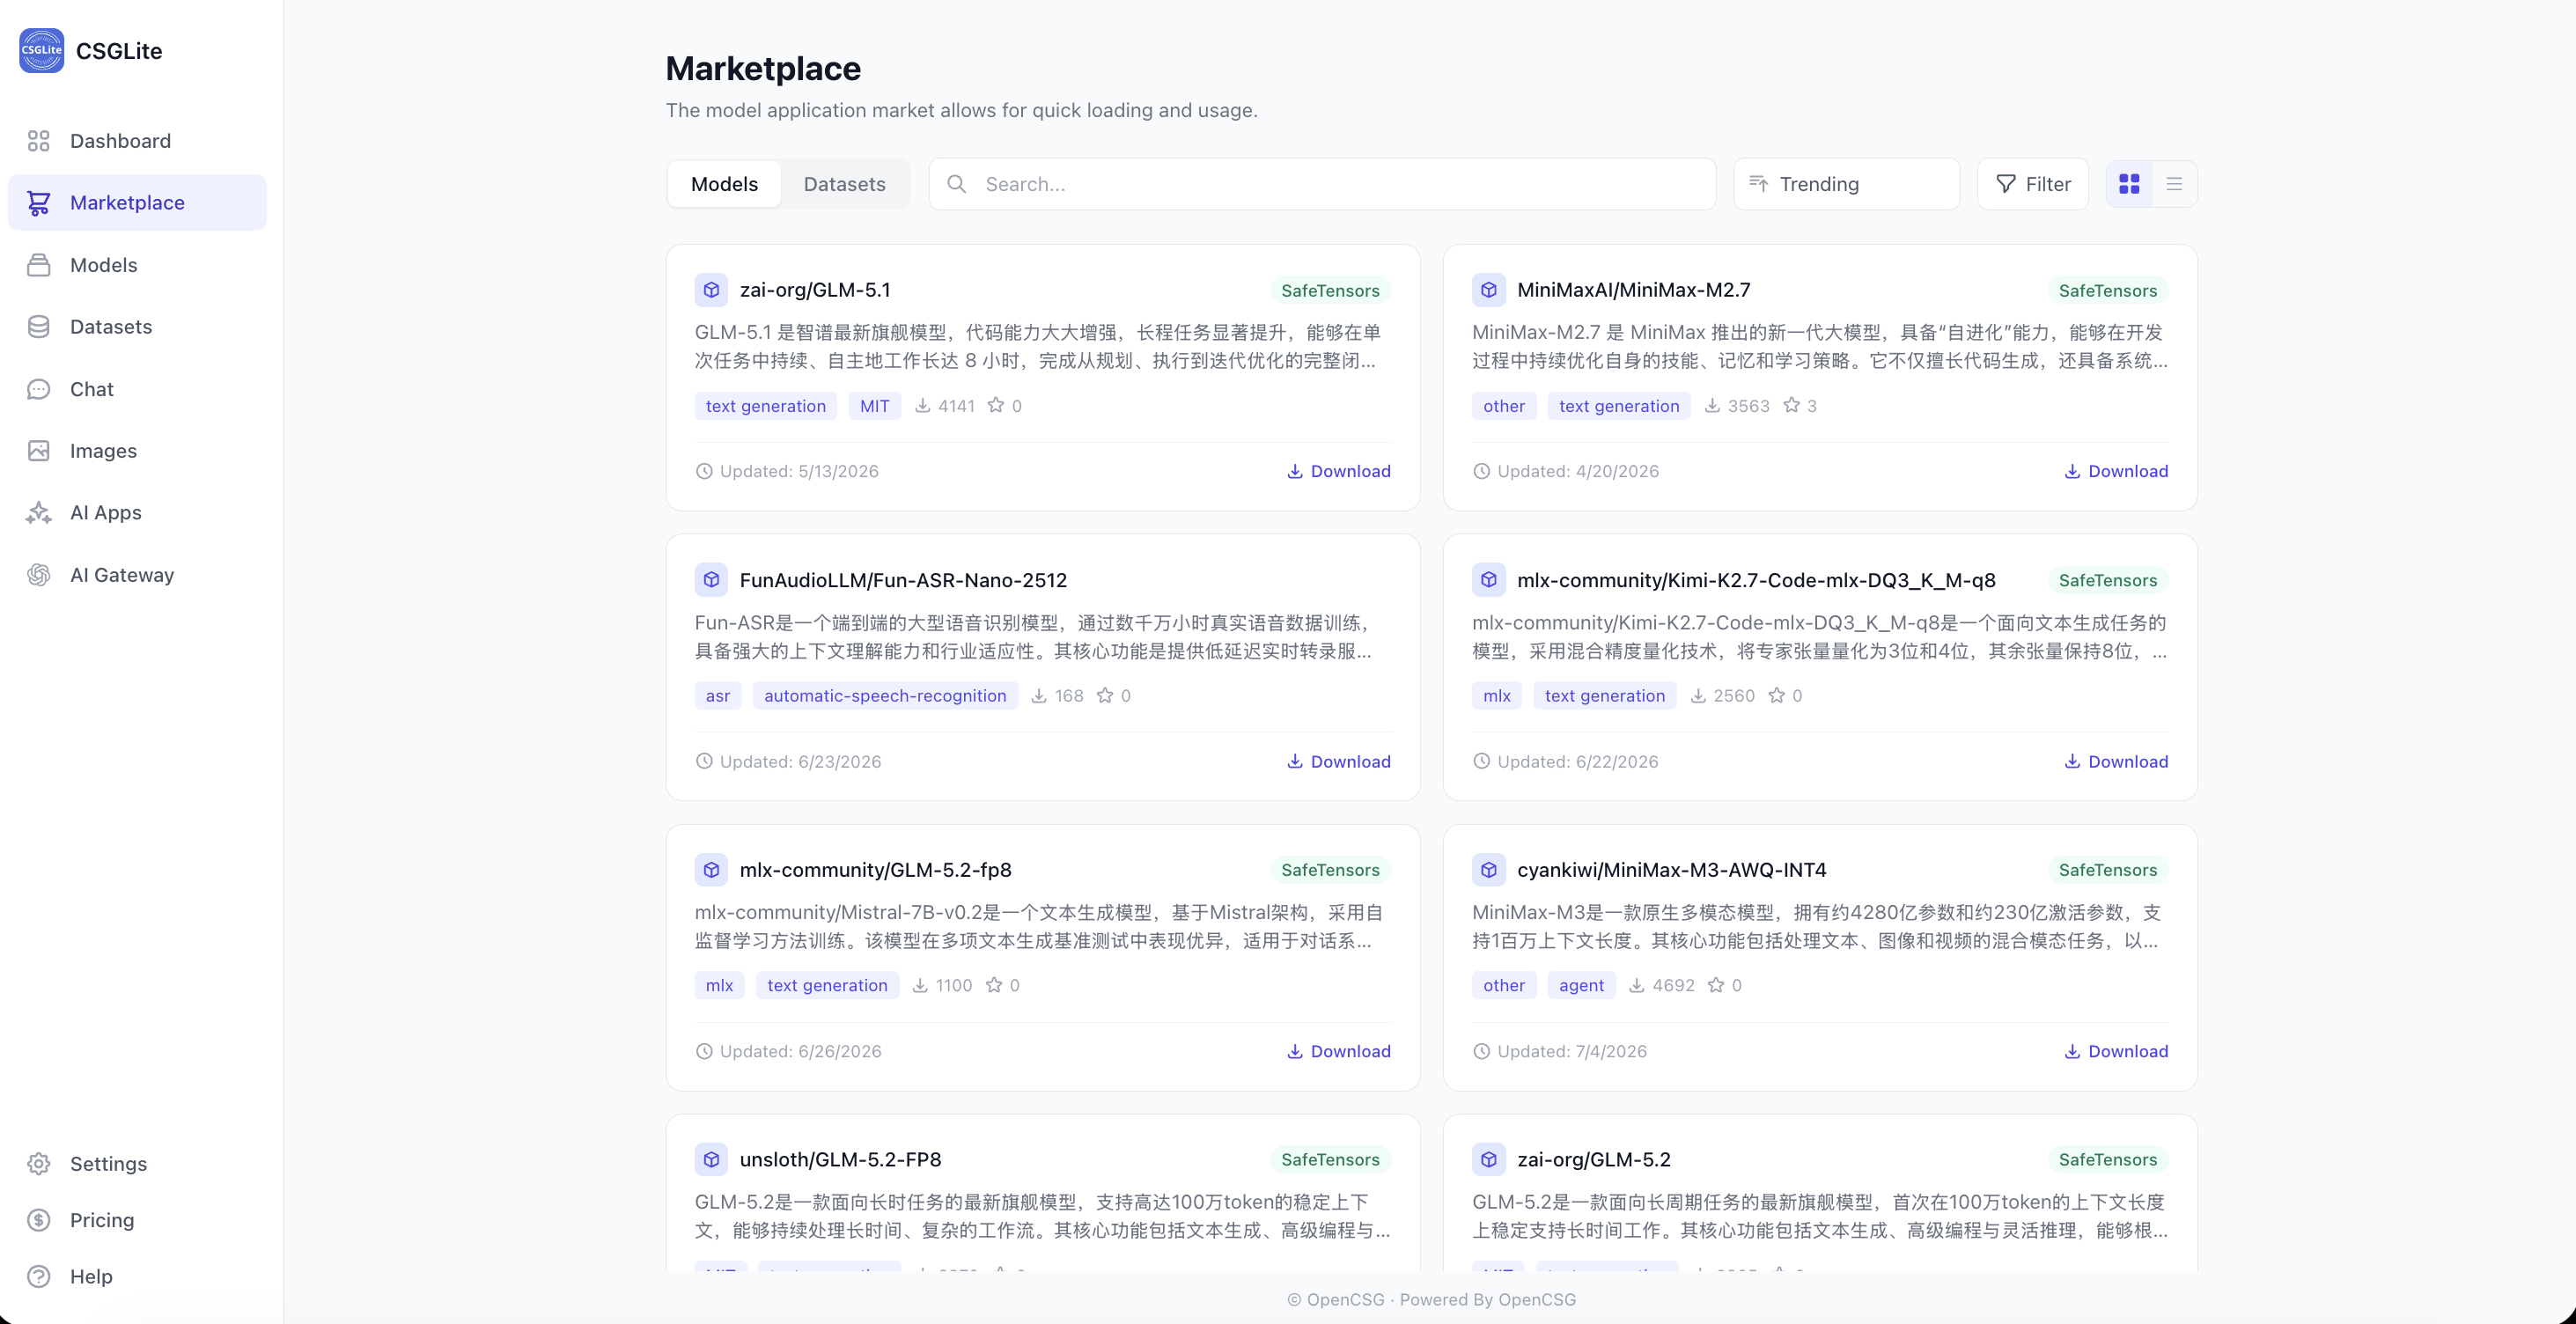
2. Marketplace - Discovery and Download
Integrates the csghub-lite search functionality, allowing users to discover new models without leaving the client.
- Global Search: Supports searching for models and datasets from the OpenCSG community.
- Download Logic: Clicking [Download] expands a progress bar in place, showing the download speed and time remaining, with support for pause/resume.
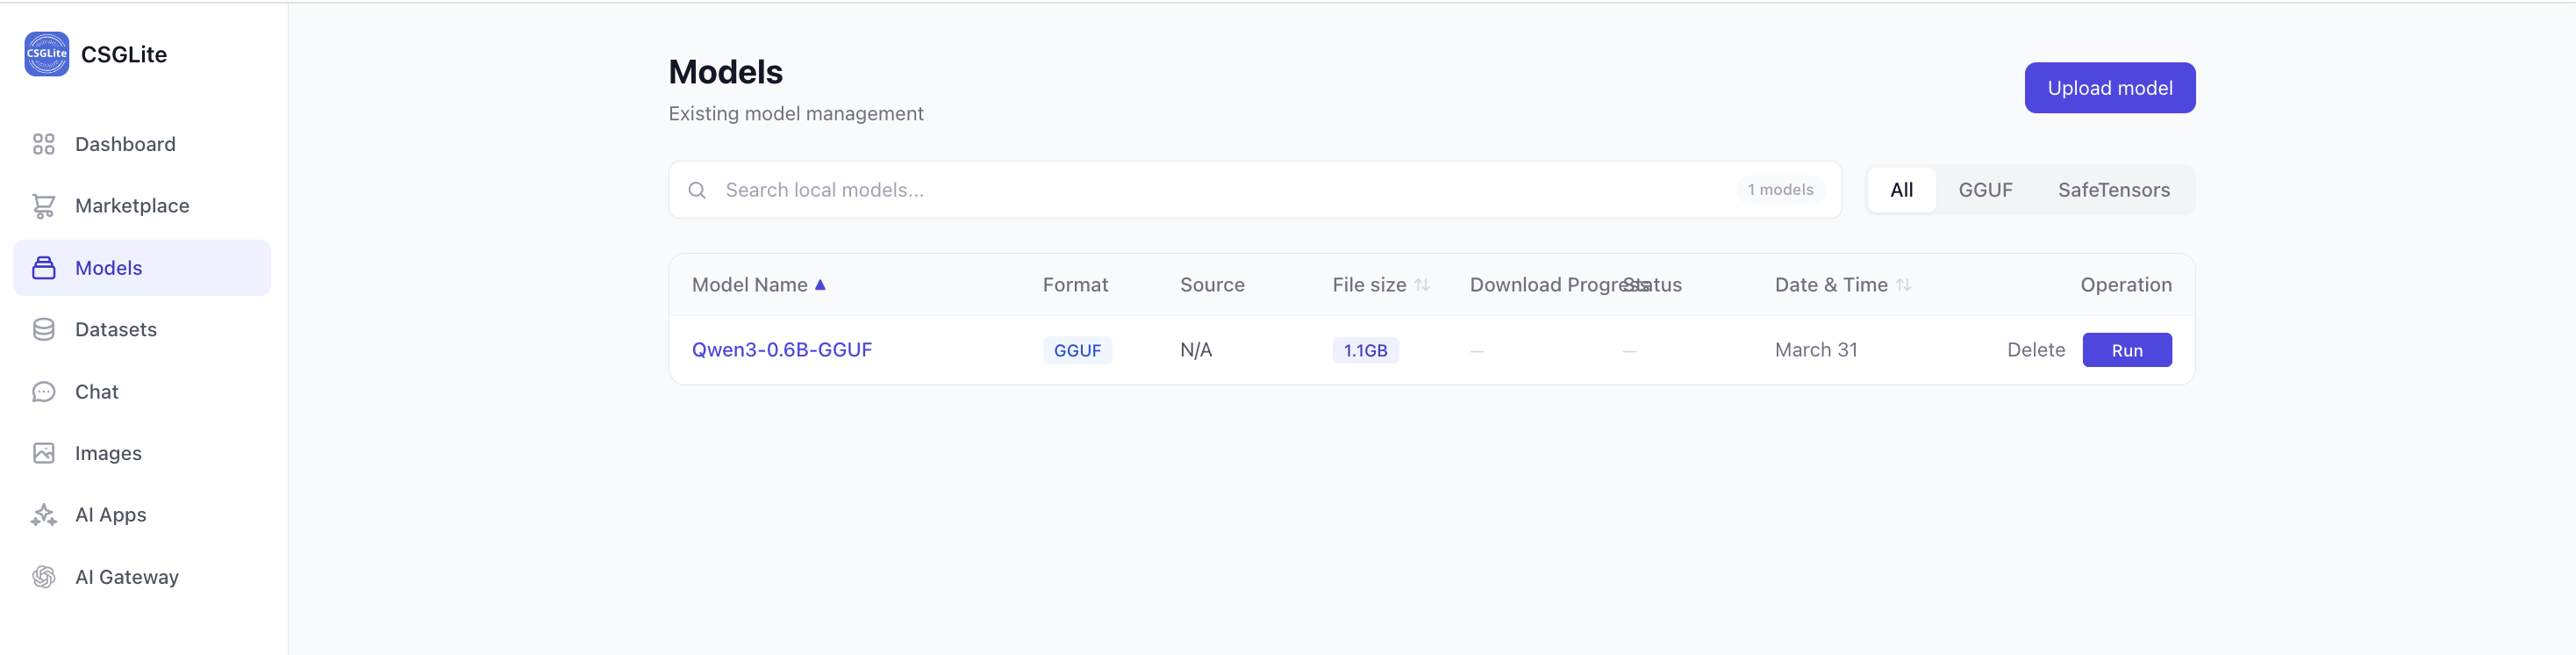
3. Model Library - Local Model Management
Manage all model files downloaded to the local machine.
- Search and Filter: The top search box supports searching by name or filtering by format (GGUF/SafeTensors).
- Model List Cards: Shows model names, formats, file sizes, and last update time.
- Operations:
- [Run]: Click to quickly start the model and enter the running state.
- [Delete]: Remove the model file from the local machine.
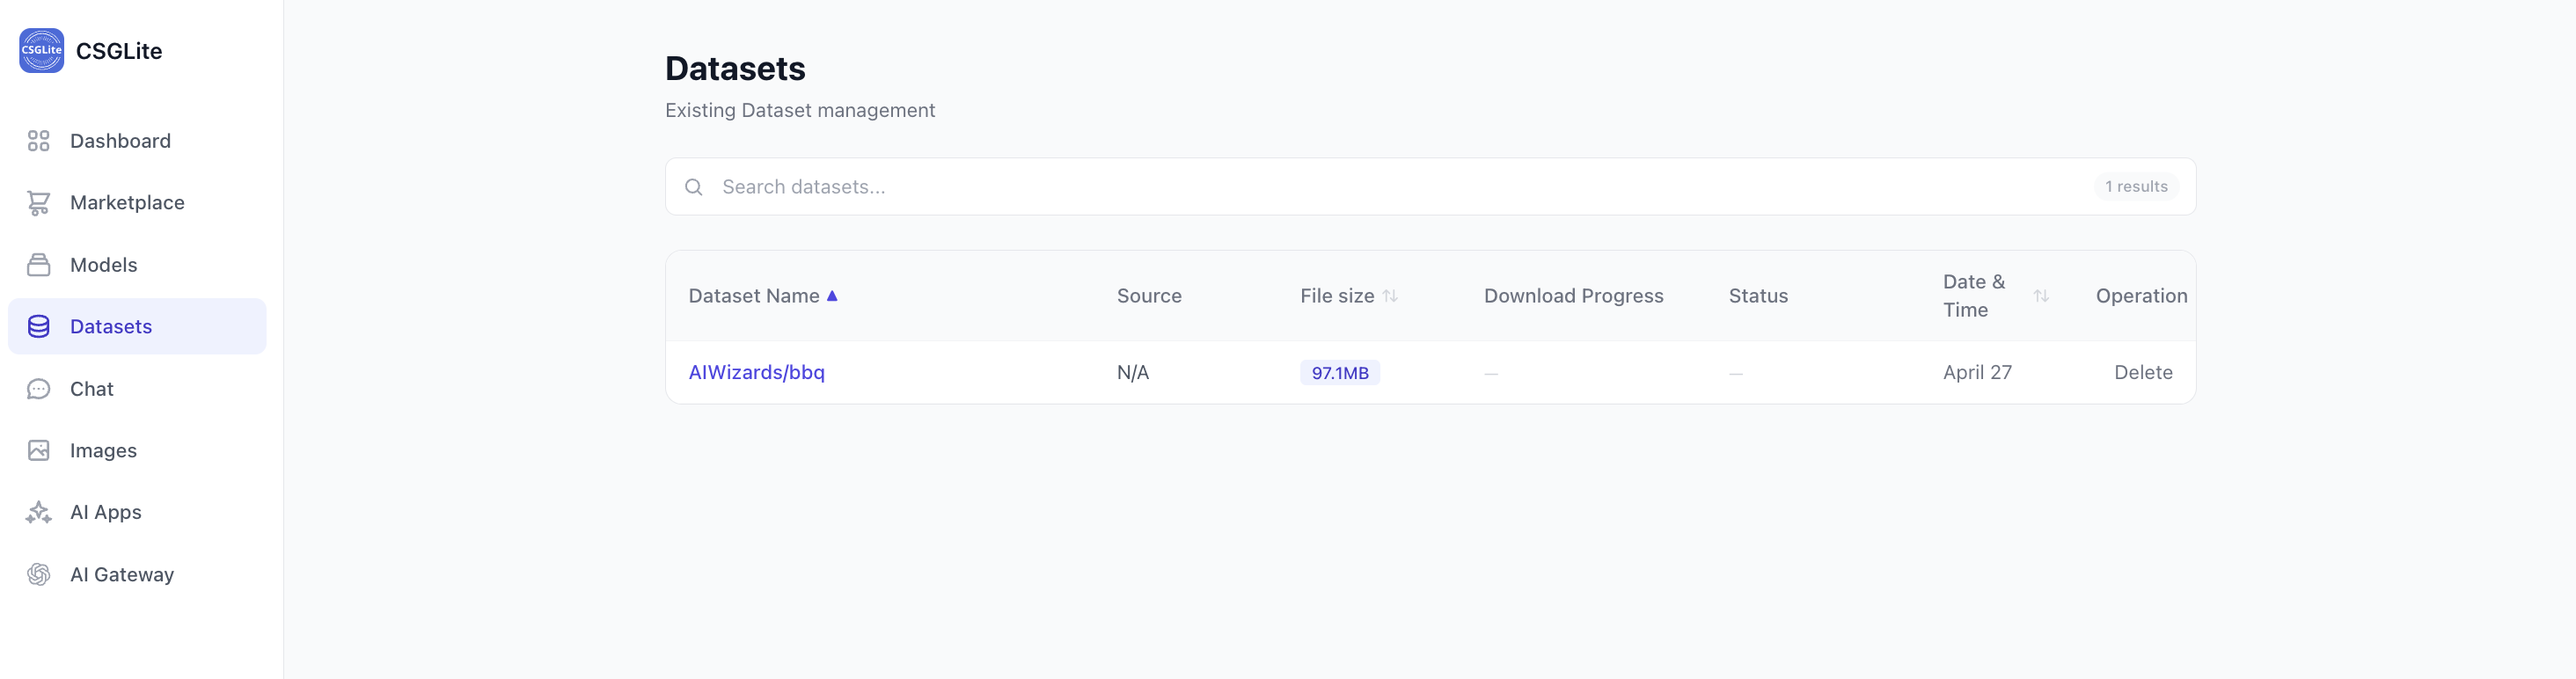
4. Datasets - Discovery and Management
Manage all dataset files downloaded to the local machine.
- Search Datasets: The top search box supports searching by name.
- Dataset List Cards: Shows dataset names, file sizes, and last update time.
- Operations:
- [Details]: View the dataset's file list.
- [Delete]: Remove the dataset file from the local machine.
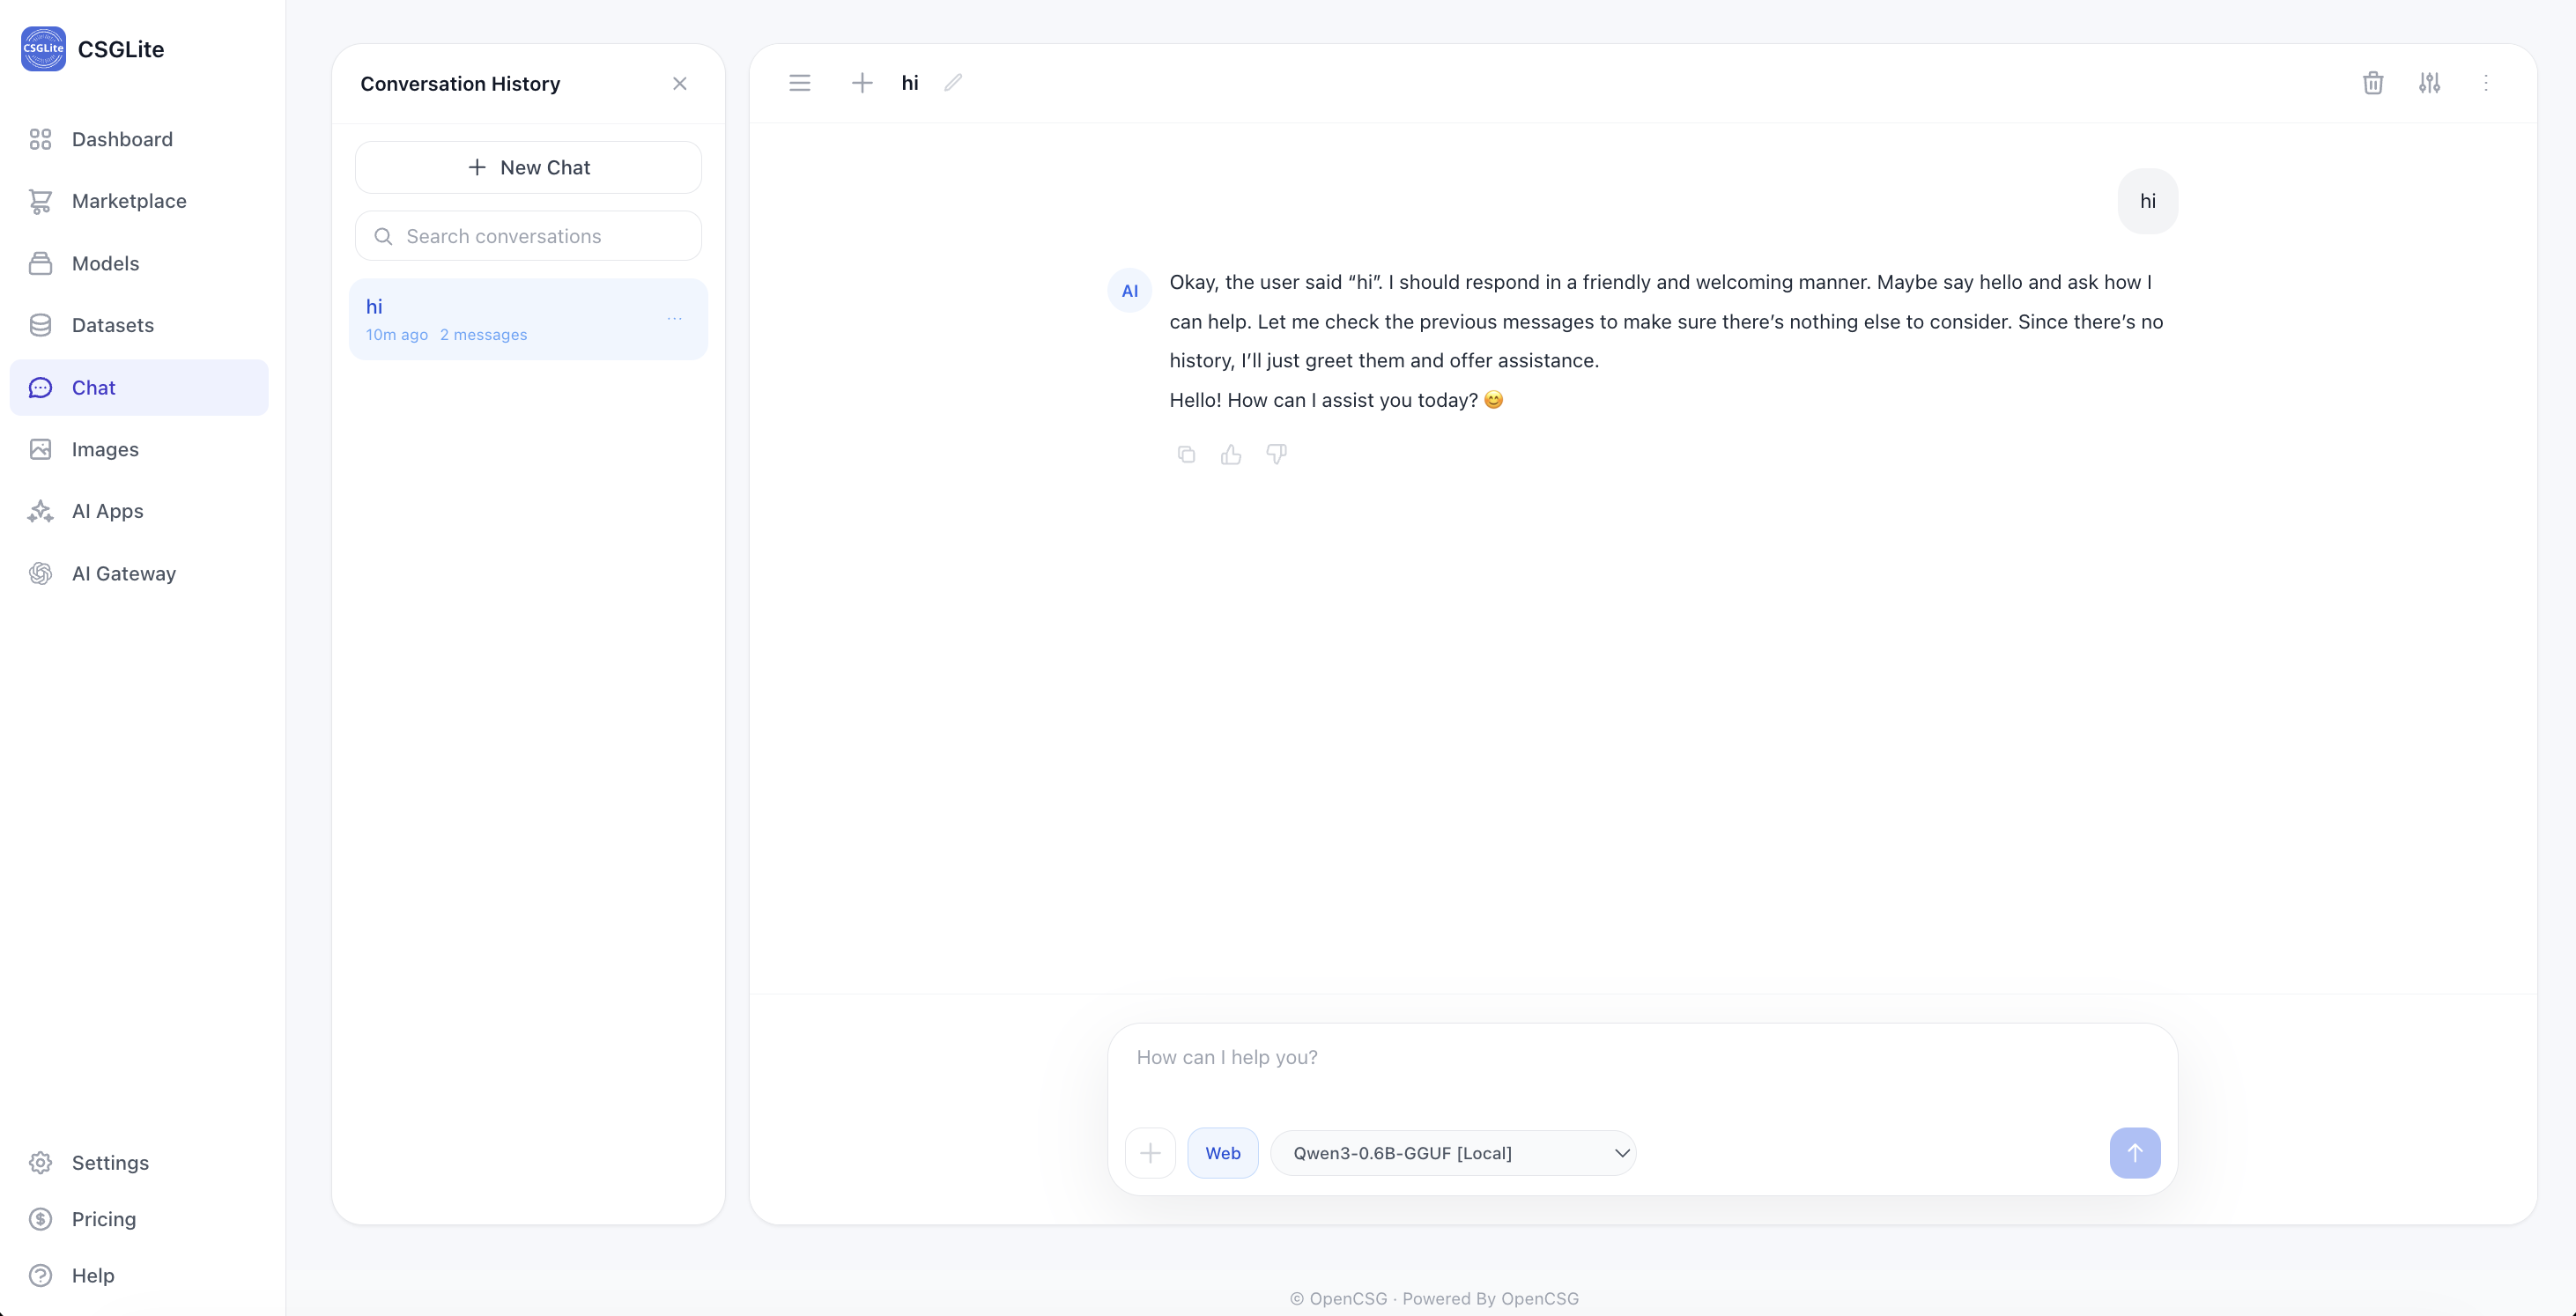
5. Chat - Interactive Conversation
An interactive chat interface for testing model effects, featuring more parameter controls.
- Model Selector: To the left of the message input box, allowing switching between models.
- Right Configuration Panel:
- System Prompt: Customize the system prompt for the role.
- Parameters: Includes sliders for Temperature, Top-P, Context Length, etc.
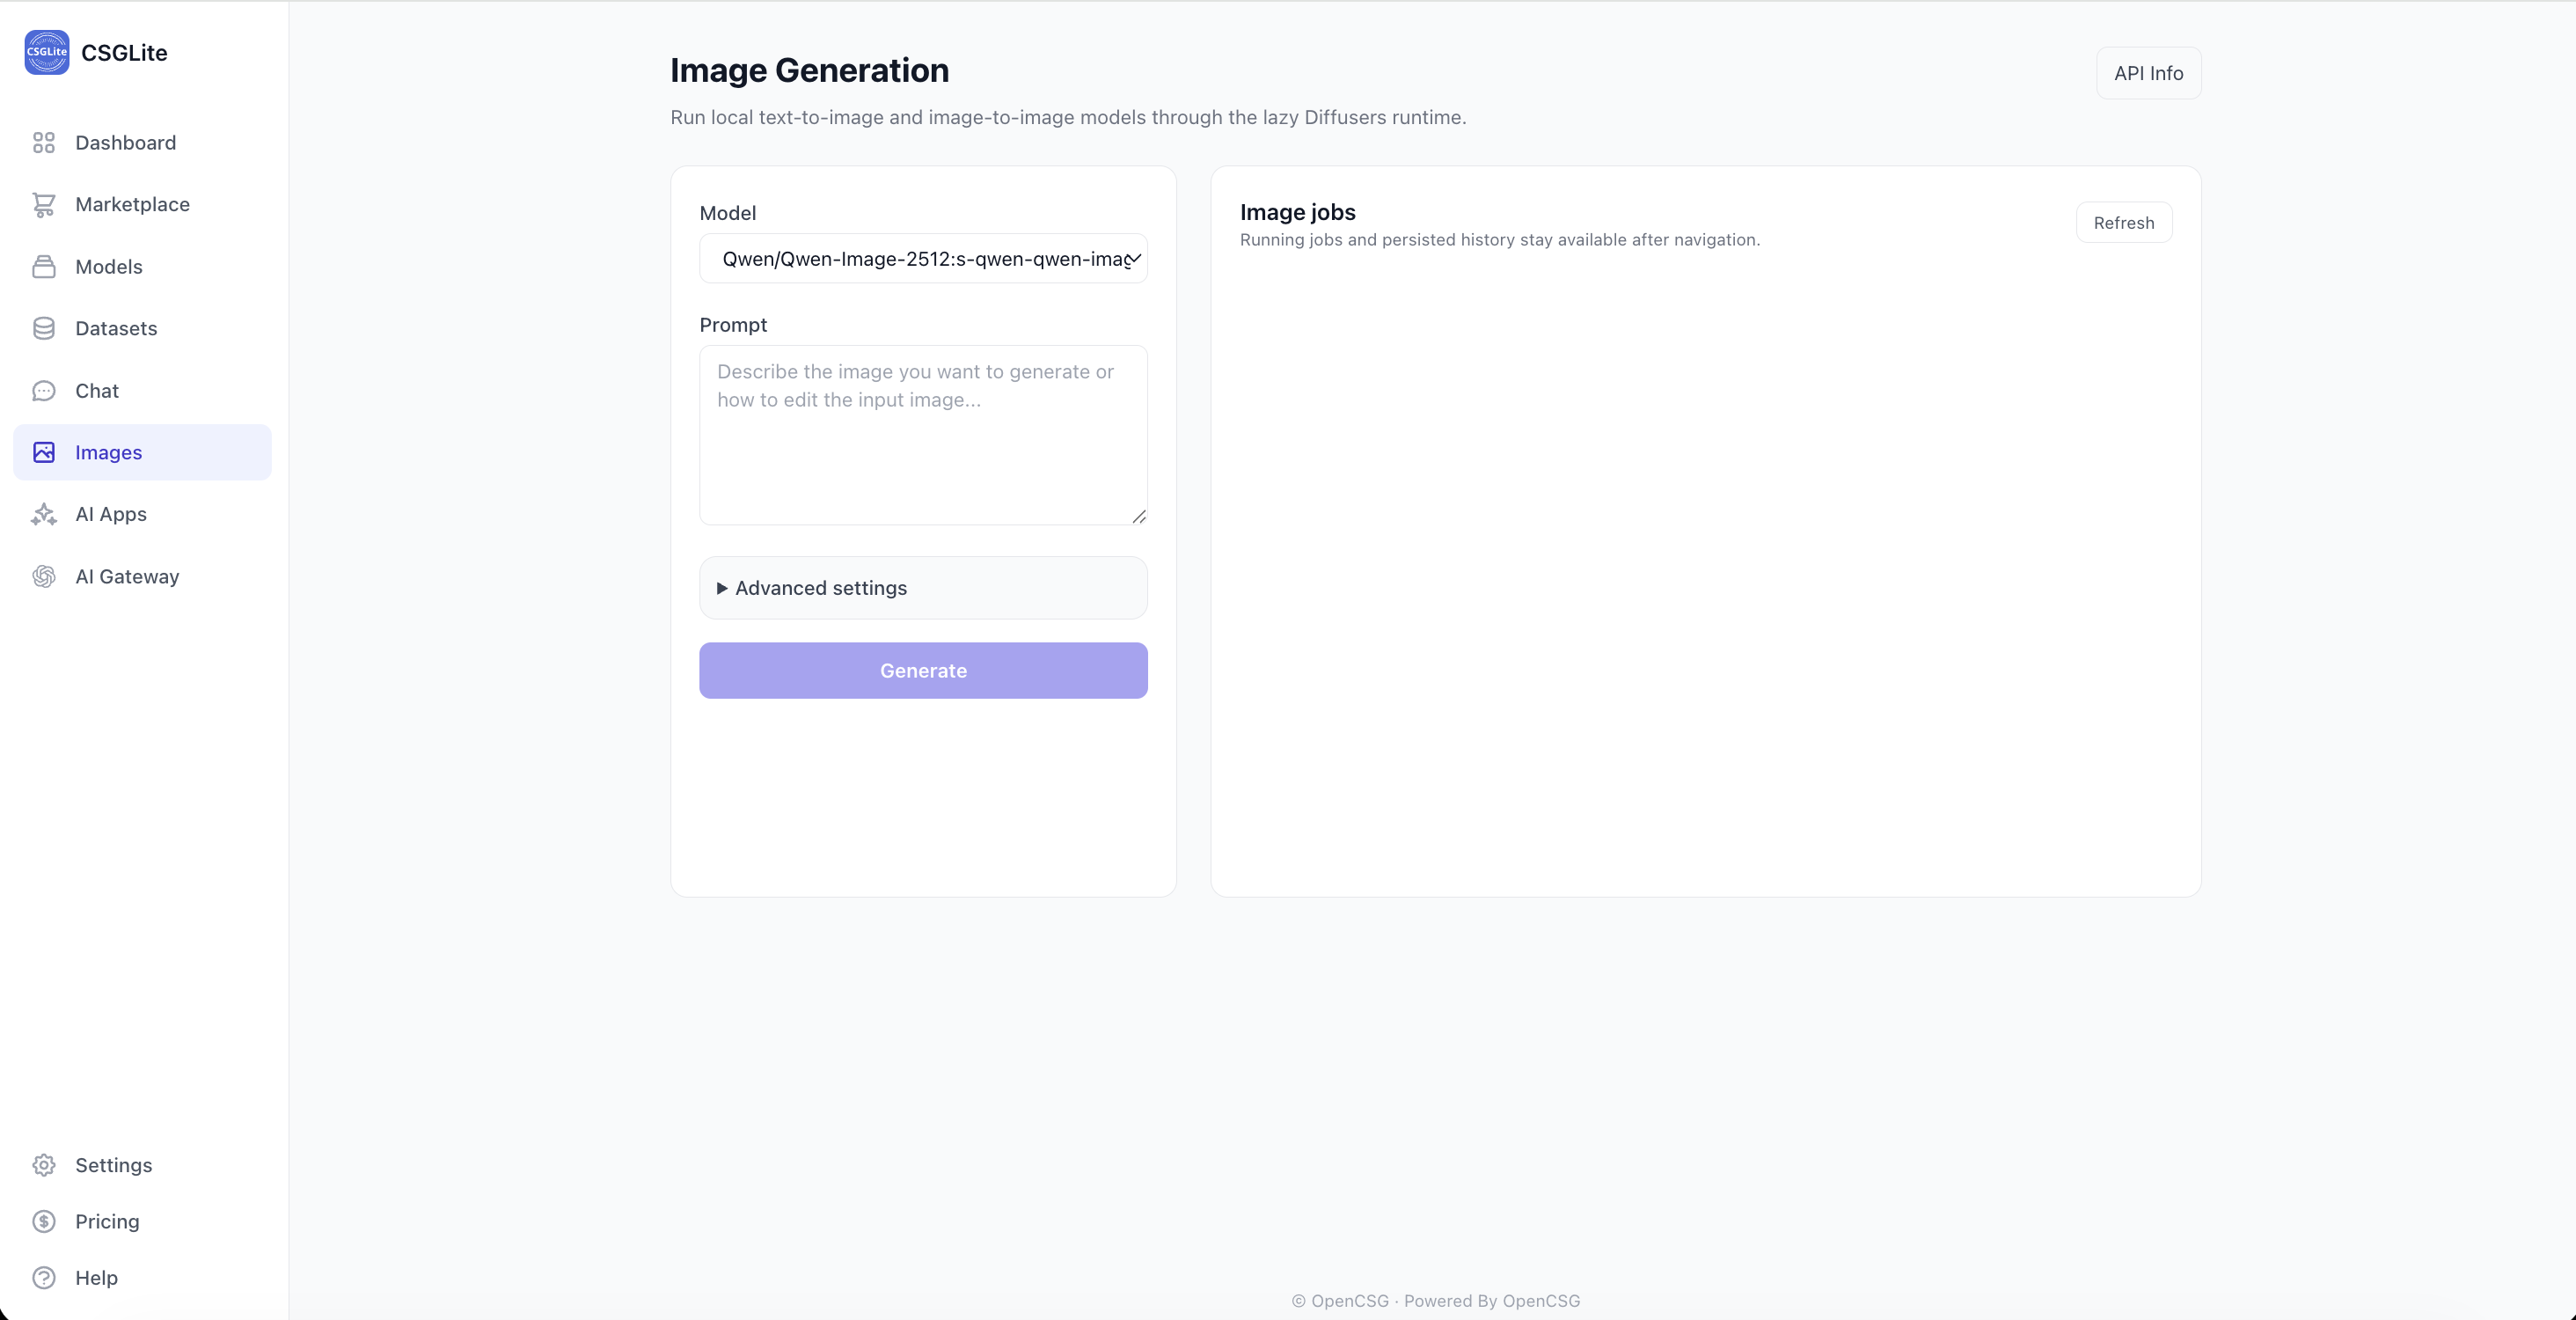
6. Image Generation - Text-to-Image & Image-to-Image
Supports generating images from text prompts (Text-to-Image) and image-to-image generation/editing.
- Account Authorization: Before using the image generation feature, you need to log in to your OpenCSG community account and obtain an Access Token. Once authenticated, the system will directly call the cloud APIs provided by the OpenCSG community for inference and image generation, without downloading or loading large image models locally.
- Parameters: Select your preferred image model and enter a prompt in the left panel. Expand [Advanced Settings] for fine-tuning configuration parameters.
- Task Management: The right panel displays currently running image tasks and historical generation records. This state is preserved even if you navigate to other pages.
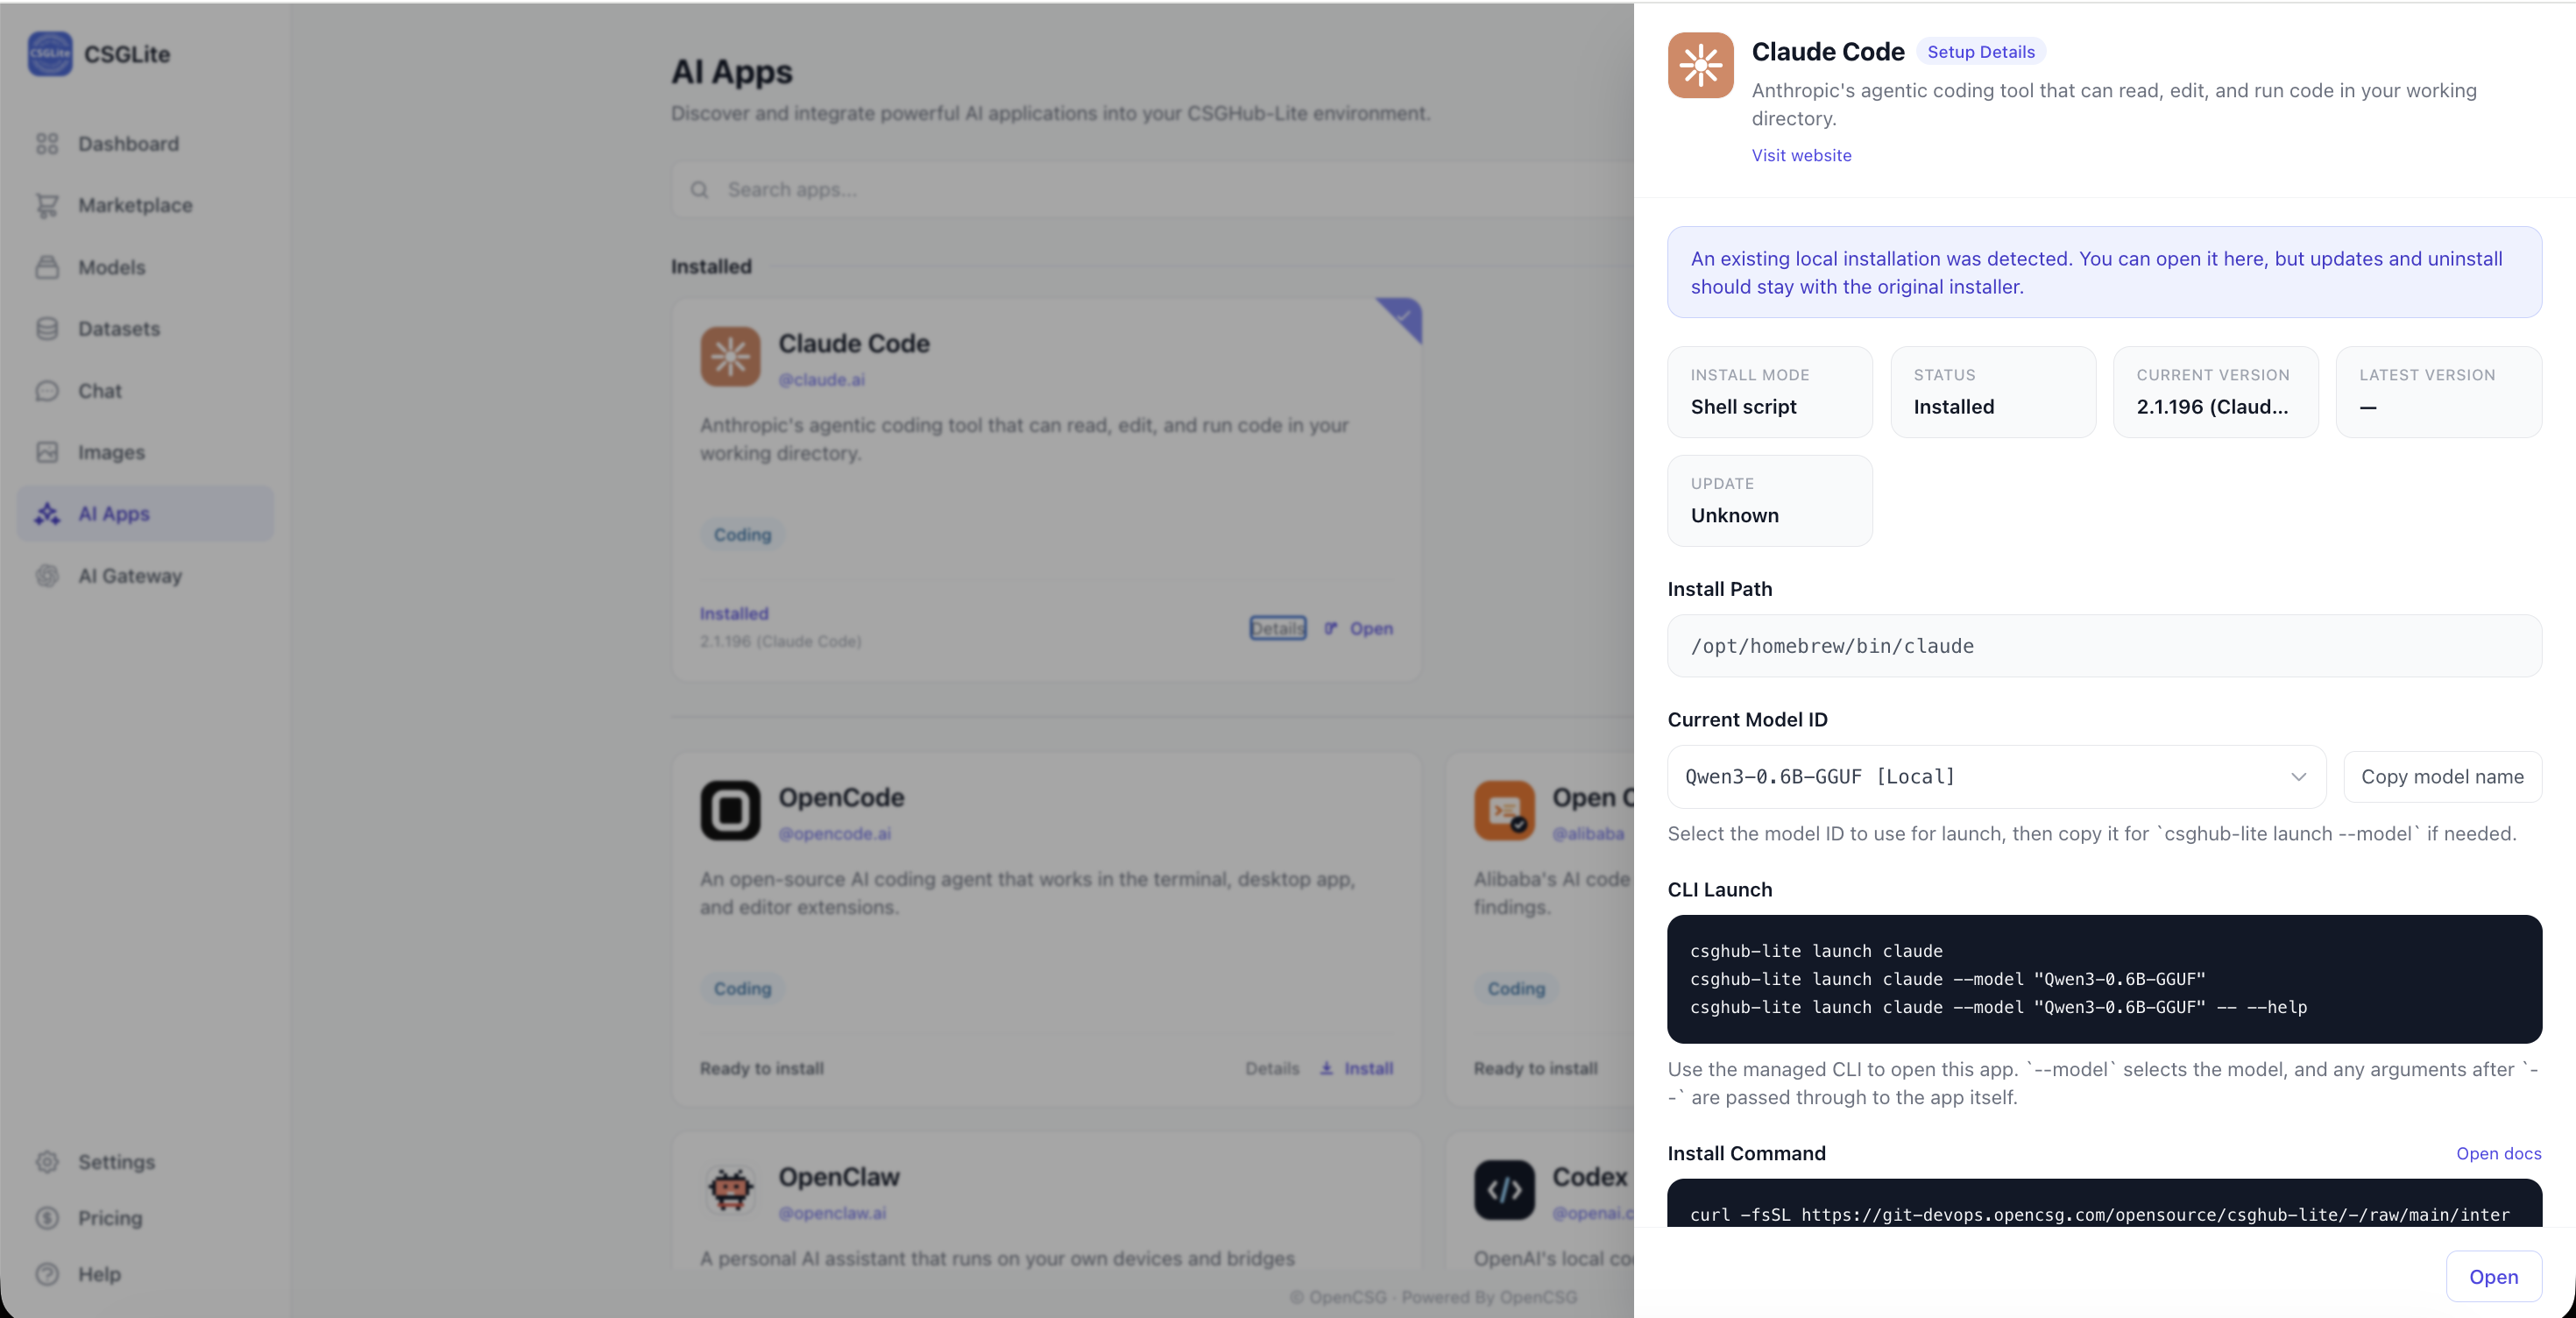
7. AI Apps - AI Application Management
A standalone application page that supports visually viewing, installing, uninstalling, and opening various AI applications. It also provides real-time installation log viewing (supporting in-depth integration with local development and agent tools like Claude Code, Codex, OpenCode, and OpenClaw).
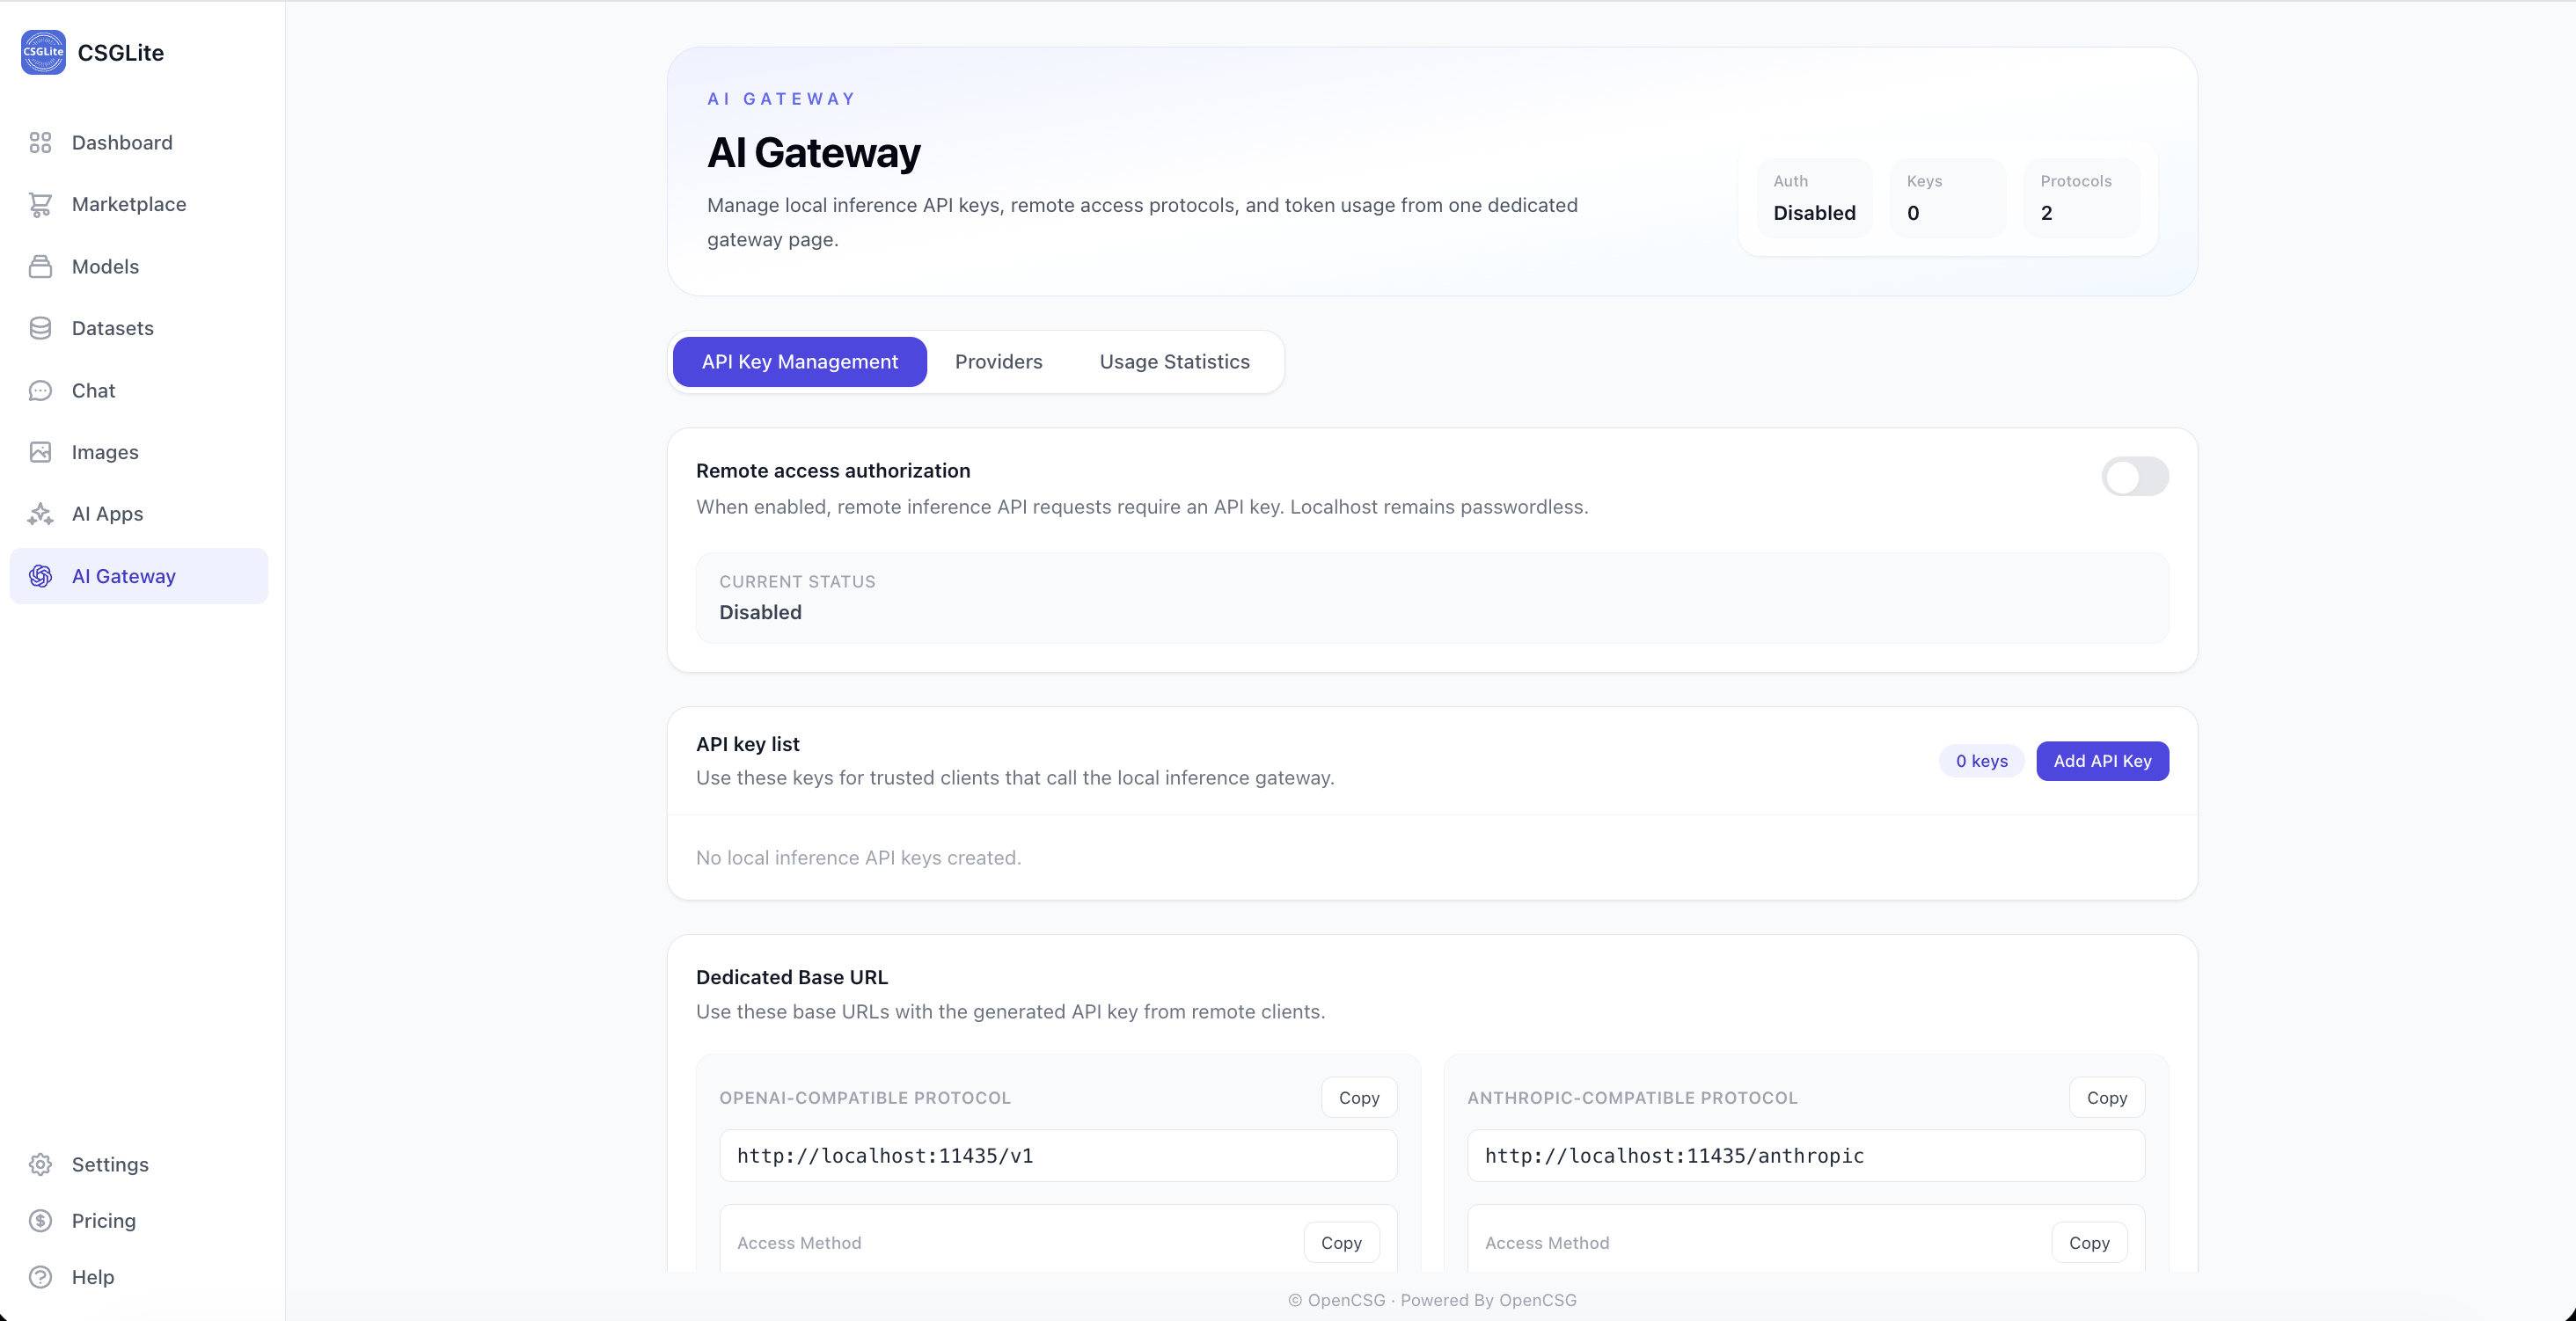
8. AI Gateway - API Access & Governance
A dedicated gateway page to manage local inference API keys, remote access protocols, and token usage statistics, providing a unified and secure endpoint for multi-model collaboration.
- API Key Management: Easily enable or disable remote access authorization (when enabled, remote inference API requests must carry an API Key; local
localhostaccess requires no authentication). You can add, manage, and delete local inference API keys here. - Multi-protocol Support: Default dedicated Base URLs are provided for OpenAI-compatible API protocol (e.g.,
http://localhost:11435/v1) and Anthropic-compatible API protocol (e.g.,http://localhost:11435/anthropic), enabling quick integration for third-party clients and agent tools. - Other Features: Configure different underlying providers and view detailed API usage statistics.
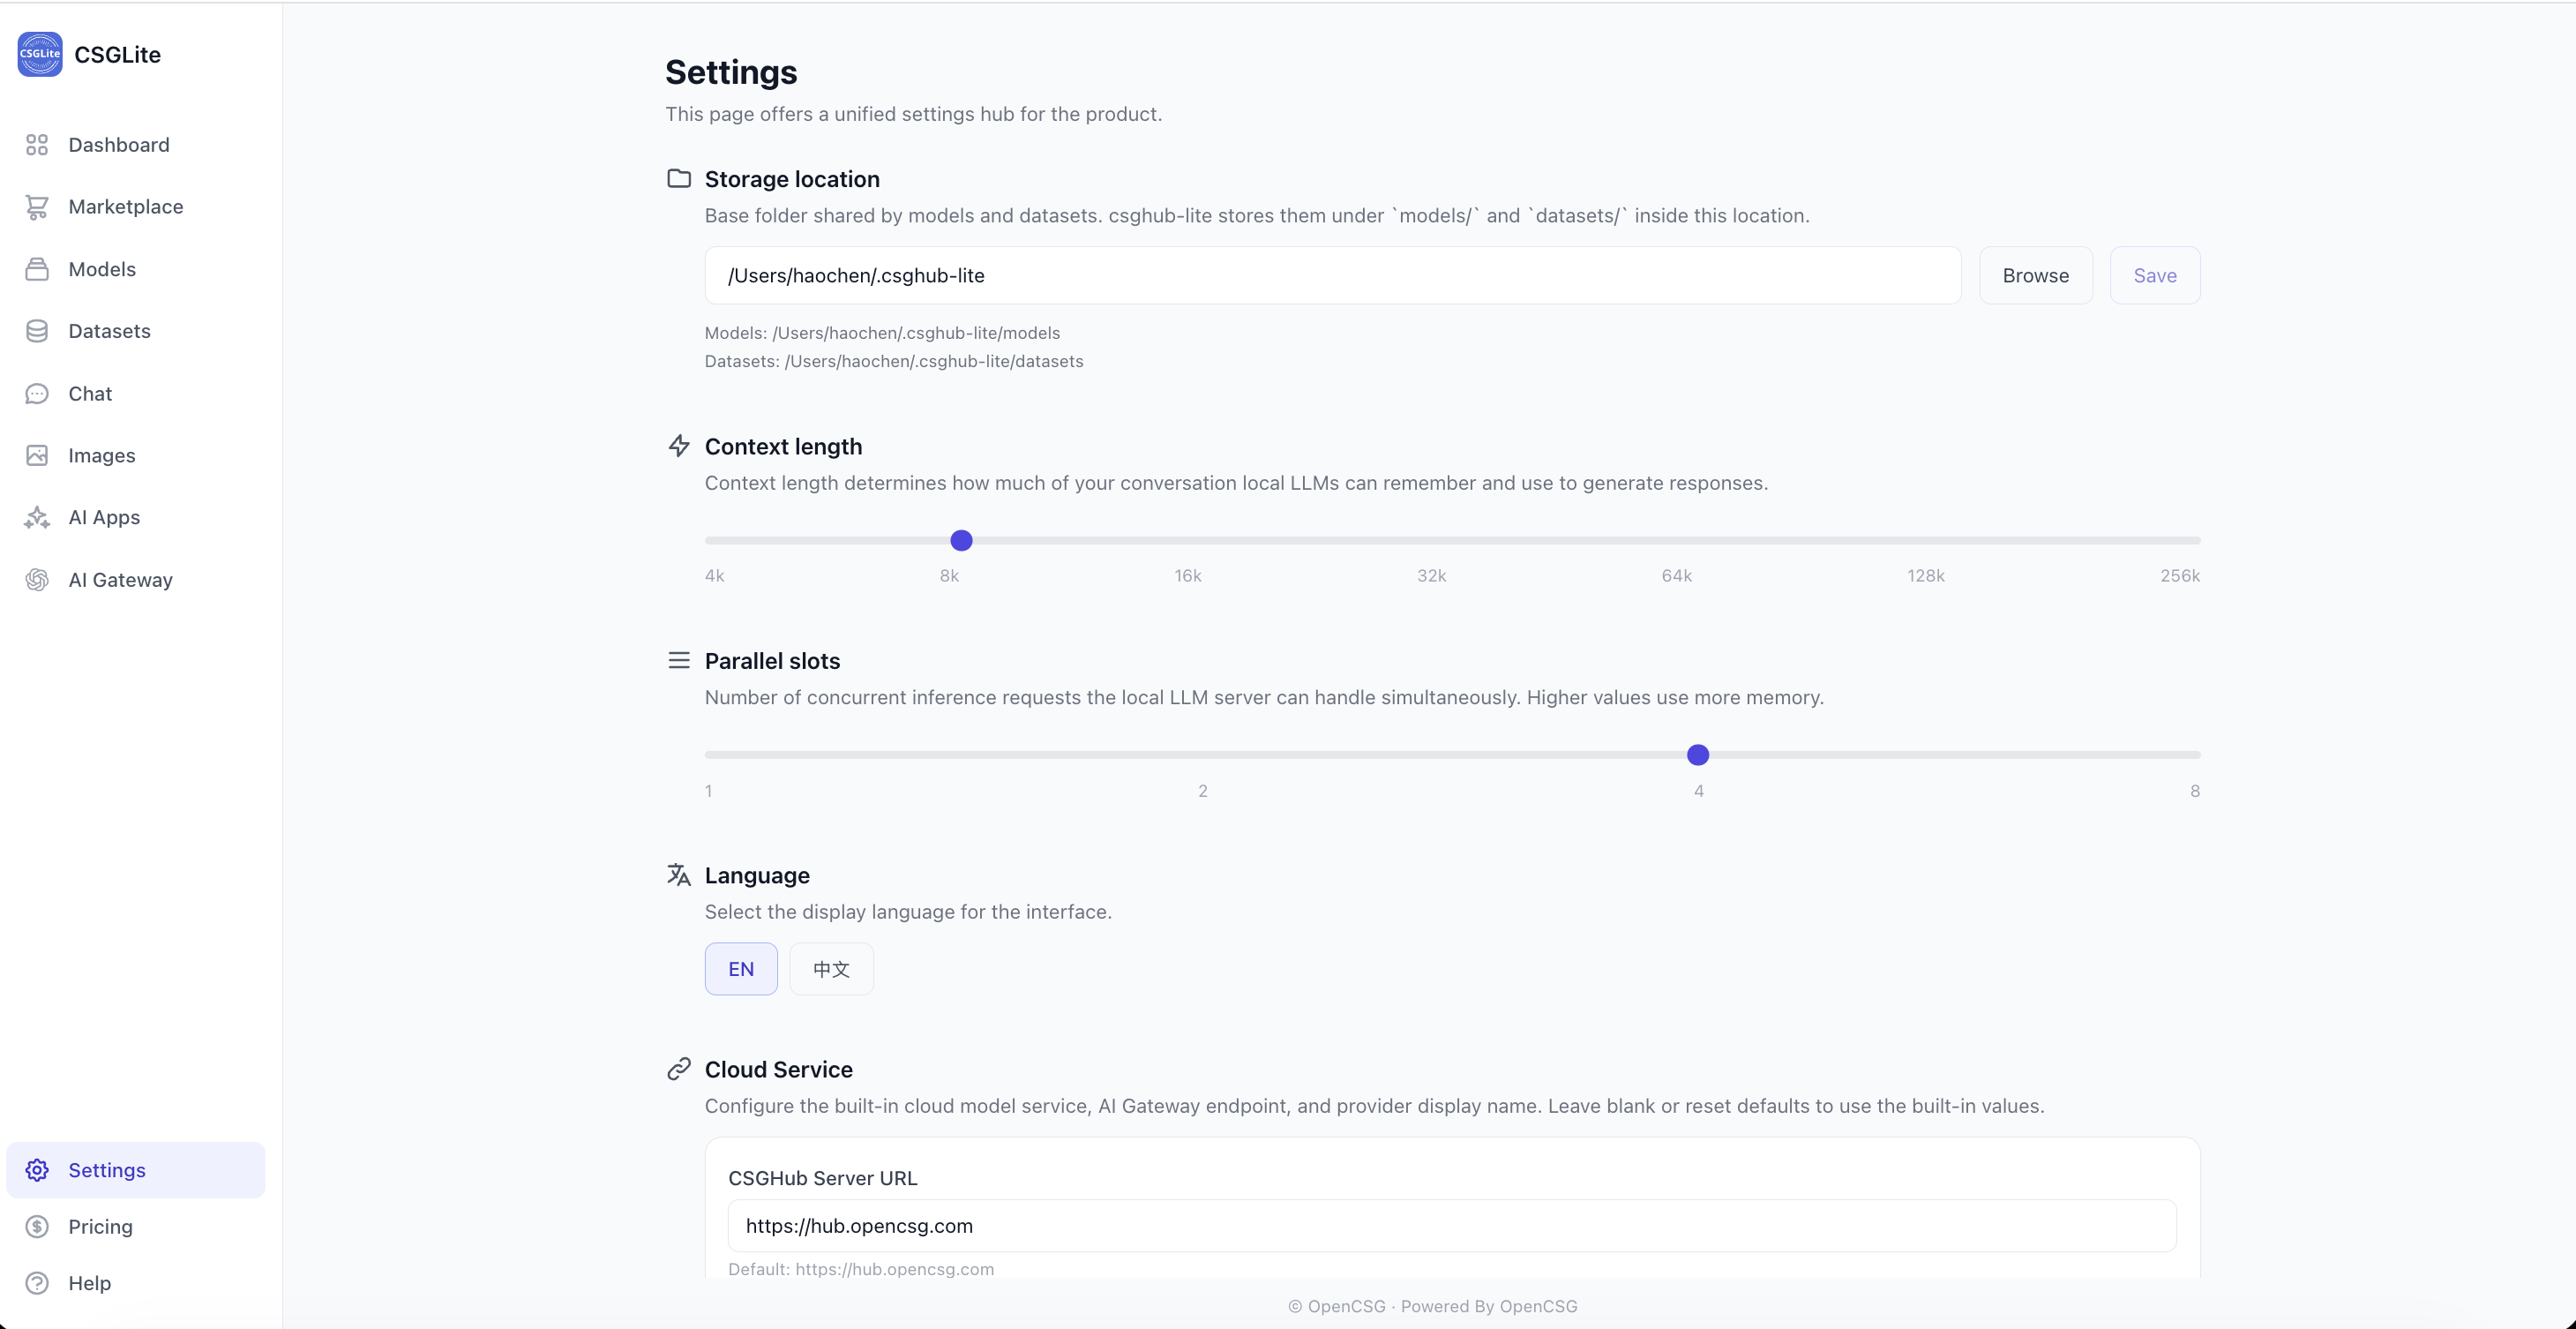
9. Settings - Unified Management
This page serves as a centralized settings hub for personalizing CSGLite according to your needs.
- Model Storage Location: View and customize the path where local model files are stored.
- Context Length: Adjustable slider (4k - 256k) to set the context window for local LLMs, determining how much conversation history the model can "remember".
- Language Switch: Quickly toggle between EN (English) and 中文 (Chinese).
- Version Info: Displays the current version number of the client.
- Restore Defaults: A one-click button to reset all settings to their original configuration.